Contact Information: Media Contact: Michelle Sabolich Atomic PR for Clear Capital (415) 402-0230
Clear Capital Reports U.S. Home Prices Rise 5% and All Regions See Quarterly Gains
First Index to Report U.S. Home Price Gains Last Month Shows Continued Improvement for July; High REO Saturation Levels Keep Markets Volatile; Cleveland Once Again Posts Strong Results; and Parts of Phoenix Show Signs of Growth
| Source: Clear Capital
TRUCKEE, CA--(Marketwire - August 6, 2009) - Clear
Capital™ (www.clearcapital.com), a premium provider of data and
solutions for real estate asset valuation, investment and risk assessment,
today released its Home Data
Index™ (HDI) Market
Report, which last month took the lead in reporting the first U.S. home
price gains in more than three years. Patent pending rolling quarter
technology significantly reduces the multi-month lag time associated with
other indices to help investors, loan servicers and individual buyers and
sellers make more informed, timely and profitable decisions. This month's
report features data compiled through July 25, 2009.
Key highlights for June 26-July 25 include:
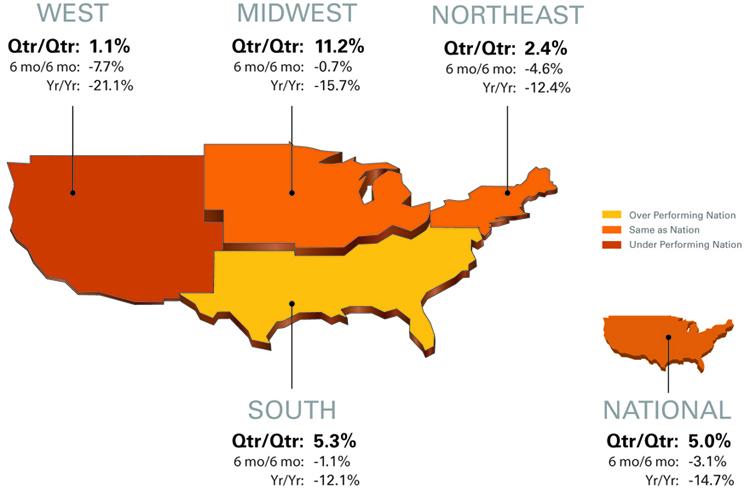
-- National / Four Region Overview: National quarter-over-quarter gains
improve to 5 percent, with the Midwest (11.2%), South (5.3%), Northeast
(2.4%), and West (1.1%) regions all posting gains.
-- Metropolitan Statistical Area (MSA) drilldown: Continued high real
estate owned (REO) saturation levels add to market volatility; Cleveland
once again posts strong results.
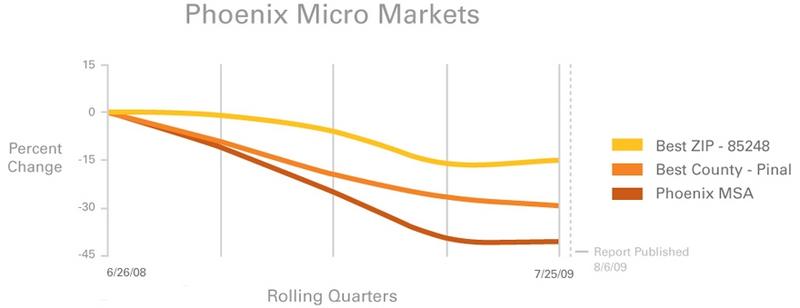
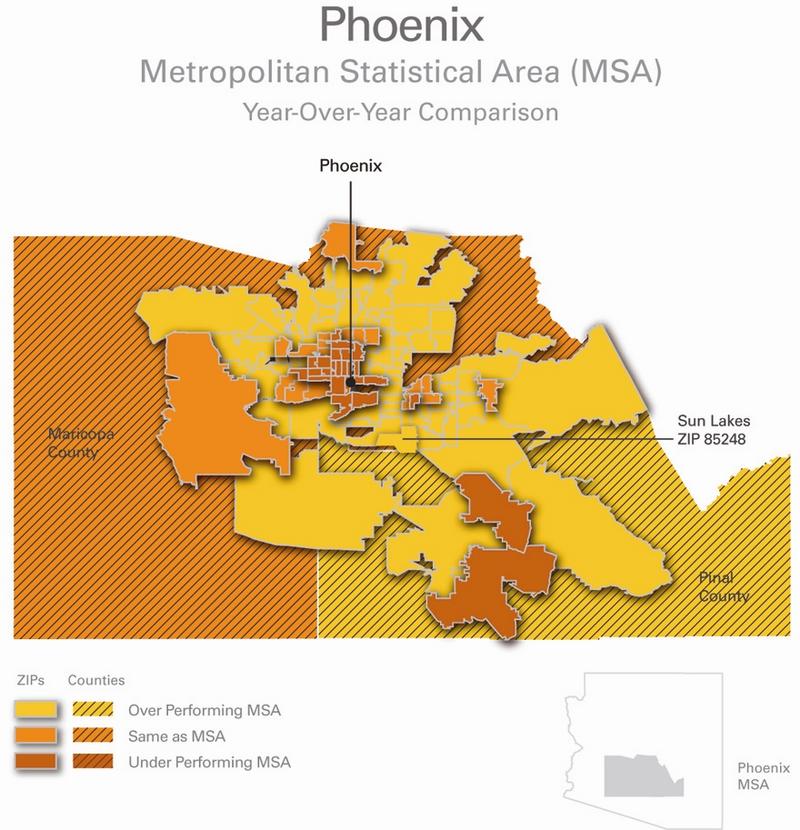
-- Micro Market Analysis: The Phoenix MSA's longtime downward spiral
showed signs of improvement. The price change for local market Sun Lakes
(ZIP 85248) was -15.2 percent for the year (compared to -41.3% for the
Phoenix MSA); and even produced a 1.2 percent gain for the quarter.
The Clear Capital HDI Market Report offers the industry, investors and
lenders a near real-time look at pricing conditions not only at the
national and metropolitan level, but within local markets. Clear Capital
data is built on the most recent data available from recorder/assessor
offices, and then further enhanced by adding the Company's proprietary
market data for the most comprehensive geographic coverage available.
"While we see yet more improvements in the quarterly price trends, REO
activity remains very high," said Kevin Marshall,
President of Clear Capital. "The summer season, combined with increased
opportunity for investors and home buyers, helped the most severely
impacted markets ease the home price slides experienced this past winter."
"Since we first broke the news of an upward tick in home prices last month,
other indexes have since reported similar findings, spawning debate on
whether this is the bottom, or just a seasonal bump. Adjusting for
seasonality creates another layer of estimation that can be erratic
year-over-year," said Marshall. "People do buy and sell more homes in the
summer, and as a result prices do increase during this season. National
level loan servicers, local buyers and investors need to know what is going
on in specific markets right now as they manage the remarketing of millions
of defaulted properties."
Marshall added, "As with any housing recovery, small pockets of
neighborhoods and specific price tiers are leading the way and posting
gains. As individual markets turn, it's very easy to under price REO
listings when you don't have the most recent, geographically relevant data.
Everyone working to get us out of this downturn needs to be very aware of
this."
"So, if buyers, investors and the banks managing REOs know a neighborhood
in Cleveland, for example, is appreciating in price this month, they can
make more informed decisions and the markets will be healthier in the long
run," said Marshall. "National price trends are interesting and this is
most likely not a pricing bottom; however, local, timely price trends are
perhaps more critical for everyone in the industry to discuss."
National/Four Region Market Overview (June 26, 2008 - July 25, 2009)
The National quarterly price gain grew to 5.0 percent this month (up from
July's 1.7 percent increase), reflecting a wide-reaching improvement in
price declines across all four U.S. regions.
The Midwest continues to experience a strong summer compared to last
winter, softening its yearly loss to -15.7 percent. The West capitalized on
improving demand to turn its still heavily REO-saturated markets into
positive quarterly territory. The South continued to shine and moved into
the top position, posting a yearly loss of only -12.1 percent.
The spread between regions continues to shrink as well, with a 9.0 point
range between the lowest performing West region (-21.1%) and the highest
performing South region (-12.1%) in terms of yearly price change. However,
REO saturation rates remain very
high in the West and Midwest, which typically increases the volatility of
these markets and may add resistance to the continued closure of this gap
as we head into the fall.
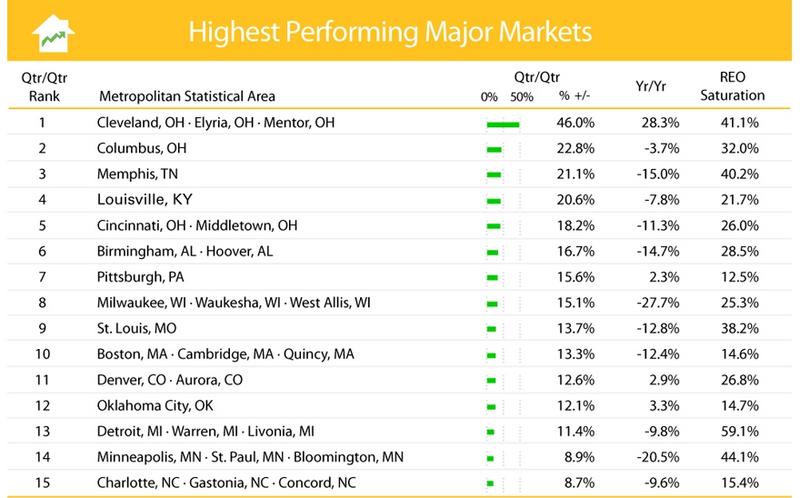
Metro Markets (June 26, 2008 - July 25, 2009)
The large quarterly gains among the highest performing markets continue to
quickly shrink yearly losses. More than half of the highest performing
markets doubled the quarterly gains reported last month. These gains
reflect improving market demand allowing banks to receive a higher sales
price for their REO properties, which can represent 60 percent of all sales
in some regions.
Ohio's markets continue to lead the Midwest with large quarterly gains
relative to the market lows seen last winter. While the large gains are
both impressive and informative with regard to demand for distressed
properties, they are best interpreted in context of the market's valleys
and peaks. Cleveland's prices match levels of early 2008, while Columbus
and Cincinnati remain at price levels seen last fall. These levels place
Cincinnati, the best performing of the three Ohio markets since they peaked
in mid-2005, with a price change of -25.4 percent, while Cleveland remains
-64.9 percent since that time. To illustrate this point, a typical lower
priced home in Cleveland that was valued at $85,000 during the market's
peak in 2005, as an REO would likely have sold for $20,500 last winter, and
today might sell for close to $30,000.
Additionally, while there was some improvement in the REO saturation rates,
many of the top performing markets continue to stay at rates close to, or
higher than, the national average of 33.1 percent. This reflects the
continued impact of foreclosures, and indicates that the large quarterly
gains are driven by positive price changes in REO properties.
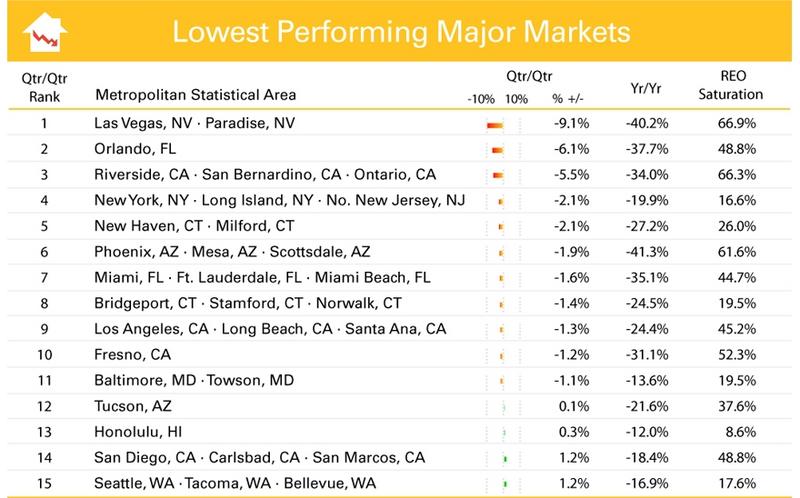
While all of the lowest performing markets still show substantial negative
price returns over the past year, they are showing signs of improvement.
Twelve of the fifteen markets listed posted quarterly results no greater
than a three percent decline, and none of them returned double digit
quarterly losses. In addition, positive quarter-over-quarter returns in
four of these markets further suggest wide-reaching improvement in price
declines across the U.S.
Phoenix, the subject of our micro market report this month, is showing
signs of improvement -- posting a modest price change of -1.9 percent for
the quarter. New York moved up the list into fourth position, despite
slowing its quarterly decline over each of the prior two months. This
change in New York's ranking reflects the overall improvement among the
rest of the markets more than a decline in the Northeastern markets.
As with the highest performing markets, REO saturation rates remain high,
keeping large portions of these markets subject to additional volatility
going forward. At the same time, the large proportion of distressed sales
amid increased sale volumes may help keep escalating REO supply at bay,
especially if demand continues into the fall.
Micro Markets (June 26, 2008 - July 25, 2009)
This section highlights a single market every month with a deeper dive into
how the micro- and macro-markets relate to each other.
The Phoenix area saw the largest yearly declines among the major markets
with losses reaching in excess of 40 percent. Driven in part by
speculative investments and second home demand leading up to the end of the
market's price peak in mid 2006, the area has experienced a rate of decline
that has only recently begun to soften.
With the market dominated by the populous Maricopa County (-42.4 percent
for the year), it's easy to overlook the performance of Pinal County
(-29.6%) and some of Maricopa County's peripheral cities. These locations
make up nearly sixty percent of the MSA's ZIP codes and saw more modest
yearly price declines than the MSA as a whole.
One locality that was least affected by the market's downturn and is
currently experiencing a positive uptick is Sun Lakes (ZIP 85248), a large
golfing community southeast of Phoenix that borders Pinal County. Over the
past year, Sun Lakes experienced the best price performance in the Phoenix
MSA with a price change of -15.2 percent. It also posted one of the lowest
REO saturation rates at 18.0 percent. And recently, Sun Lakes reversed its
downward pricing trend and joined a large portion of the nation with a
slight positive quarterly gain of 1.2 percent.
While Sun Lakes boasts a median price that's more than twice that of
Maricopa and Pinal counties, this higher priced retirement community has
been buoyed by its lower price segment, those homes priced below $180,000.
These homes have posted a modest -12.2 percent drop in value over the past
year, compared to -20.6 percent for homes priced over $340,000. It's
apparent that the more affordable homes within high-priced communities were
the best sellers among retirement age home seekers (who likely held
declining investment based incomes).
Clear Capital Home Data Index™ Methodology
The Clear Capital Home Data Index (HDI) provides weighted paired sales, and
price-per-square-foot index models that use multiple sale types, including
single-family homes, multi-family homes and condominiums. These models are
combined with an address-level cascade to provide sale-type-specific
analysis for thousands of geographic areas across the country. The indices
include both fair market and institutional (real estate owned)
transactions. They also provide indicators of REO activity such as REO
discount rates, REO days on market and REO saturation. The Clear Capital
HDI generates indices in patent pending rolling quarter intervals that
compare the most recent four months to the previous three months. The
rolling quarters have no fixed start date and can be used to generate
indices as data flows in, or at any arbitrary time period.
About Clear Capital
Clear Capital (www.clearcapital.com) is a premium provider of data and
solutions for real estate asset valuation and risk assessment for large
financial services companies. Our products include appraisals, broker-price
opinions, property condition inspections, value reconciliations, and home
data indices. Clear Capital's combination of progressive technology, high
caliber in-house staff and a well-trained network of more than 40,000 field
experts sets a new standard for accurate, up-to-date and well documented
valuation data and assessments. The Company's customers include 75 percent
of the largest U.S. banks, investment firms and other financial
organizations.
Legend
Address Level Cascade -- Provides the most granular market data available.
From the subject property, progressively steps out from the smallest market
to larger markets until data density and statistical confidence are
sufficient to return a market trend.
Home Data Index (HDI) -- Major intelligence offering that provides
contextual data augmenting other, human-based valuation tools. Clear
Capital's multi-model approach combines address-level accuracy with the
most current proprietary home pricing data available.
Metropolitan Statistical Area (MSA) -- Geographic entities defined by the
U.S. Office of Management and Budget (OMB) for use by Federal statistical
agencies in collecting, tabulating, and publishing Federal statistics.
Paired Sales Model -- Weighted linear model based on repeat sales of same
property over time.
Price Per Square Foot (PPSF) Model -- Median price movement of sale prices
divided by square footage over a period of time -- most commonly a quarter.
Real Estate Owned (REO) Saturation -- Calculates the percentage of REOs
sold as compared to all properties sold in the last rolling quarter.
Rolling Quarters -- Patent pending rolling quarters compare the most recent
four months to the previous three months.
The information contained in this report is based on sources that are
deemed to be reliable; however no representation or warranty is made as to
the accuracy, completeness, or fitness for any particular purpose of any
information contained herein. This report is not intended as investment
advice, and should not be viewed as any guarantee of value, condition, or
other attribute.