TRUCKEE, Calif., March 31, 2014 (GLOBE NEWSWIRE) -- Clear Capital®, the premium provider of data and solutions for real estate asset valuation and collateral risk assessment, today released its Home Data Index™ (HDI) Market Report with data through March 2014. Using a broad array of public and proprietary data sources, the HDI Market Report publishes the most granular home data and analysis earlier than nearly any other index provider in the industry.
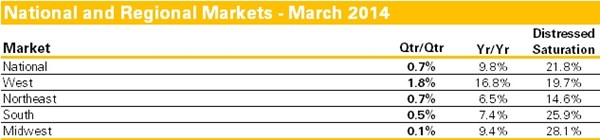
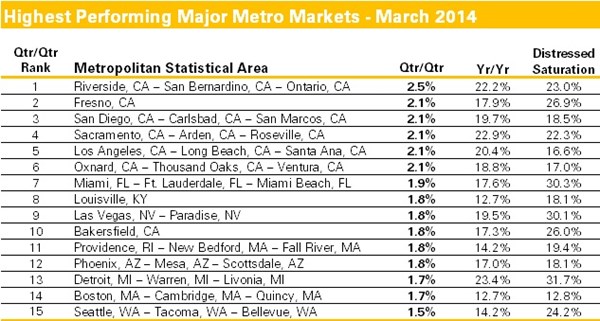
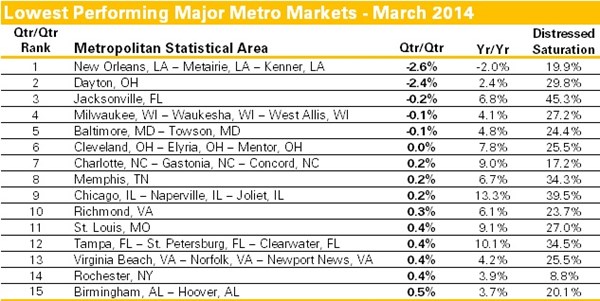
- March non-seasonally adjusted national home prices remained mostly flat over the winter, while distressed saturation over the month remained stable at 21.8% (Chart 1). Concerns over short-term declines remain in the Midwest with nearly non-existent growth over the quarter. The last time the Midwest fell into negative territory was June 2012. Five metro markets show quarterly declines, a reminder that local economies and weather matter (Charts 2 and 3).
- Low price tier home sales (homes selling for $95,000 and less) have fueled the recovery over the last two years. This deeply discounted sector attracted enough buyers to drive prices up 31.8% from the bottom of the market in 2011. Over the last quarter, however, low tier home price gains slowed to just 1.2%—a big difference from 3.7% a year ago. Stabilization, with rates of growth not seen since November 2011, could motivate first time and move-up home buyers to re-engage.
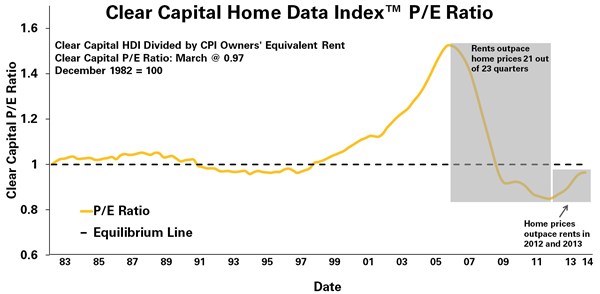
- Following the peak of the market in 2006, home prices were outpaced by the owners' equivalent of rent for 21 out of 23 quarters through 2011 (Graph 1). This environment created attractive investment returns and helped drive investor demand at the metro and sub-metro levels at a pace exceeding historical norms. While the recovery took hold, home price gains outpaced growth in the owners' equivalent of rent in most of 2012 and 2013. As prices continue to moderate in 2014 toward more historical rates of growth, investors will need to dive down into granular data and analysis to find markets where attractive home prices and rental rates still offer competitive investments.
- Contact Alanna Harter for your March 2014 file of the Top 30 MSAs or access our data on the Bloomberg Professional service by typing CLCA <GO>.
"Our data through the end of March reveals prices remained steady through the final weeks of winter, a sigh of relief to all market participants," said Dr. Alex Villacorta, vice president of research and analytics at Clear Capital. "Yet, national quarterly gains of just 0.7% mean there's certainly still risk for short-term price declines in some markets. But over the year, we see Phase Three of the recovery unfolding, which we define as moderation across all price tiers.
Analyzing rental rates and home price trends at the national level suggest the current investor pool may start to wane as the rate of home price growth outpaces the rate of owners' equivalent of rent. Don't expect investors to exit all at once. Good deals at the micro market level will persist well into 2014.
The key to overall market progress and stability in 2014 will lie in the transition from investor to traditional home buyer demand. While each segment will continue to be important, healthy markets have shown higher rates of traditional home buyer demand and less investor-driven demand. Should prices remain stable, home buyer confidence will build, supporting a balanced transition."
Housing's Price to Earnings Ratio (P/E Ratio) supports waning investor demand. As home prices rise faster than rental rates, the P/E Ratio climbs, potentially reducing investor returns within the single family rental asset class.
Graph 1: Clear Capital Price to Earnings Ratio: http://www.globenewswire.com/newsroom/prs/?pkgid=24447
Chart 1: National and Regional Markets – March 2014: http://www.globenewswire.com/newsroom/prs/?pkgid=24448
Chart 2: Highest Performing Major Metro Markets – March 2014: http://www.globenewswire.com/newsroom/prs/?pkgid=24449
Chart 3: Lowest Performing Major Metro Markets – March 2014: http://www.globenewswire.com/newsroom/prs/?pkgid=24450