San Diego, Oct. 8, 2014 (GLOBE NEWSWIRE) -- PlacementTracker, the leading source for data and analysis to institutions in the PIPE market, today announced the most active investment banks, investors, and law firms in the U.S. PIPE market through the third quarter of 2014.
Through the end of Q3, a total of $24 billion was raised in 674 transactions in the U.S. PIPE market. Of this amount, 7 transactions totaling $1.1 billion have been announced but not yet closed as of 10/03/14.
With deal volume and dollars raised continuing to outpace 2013, the market is also seeing some interesting changes. The trend towards registered offerings that participants have seen over the past five years seems to have reversed course to some extent, with the majority of growth coming from traditional unregistered deals.
Most Active Participants Include:
- H.C. Wainwright & Co., LLC as the number one most active investment bank
- Millennium Management, LLC as the number one most active institutional investor
- Sichenzia Ross Friedman Ference, LLP as the number one most active issuer counsel
- Schulte Roth & Zabel, LLP as the number one most active investor counsel
- Ellenoff Grossman & Schole LLP as the number one most active placement agent counsel
The Q3 2014 U.S. PIPE Market
Investment Banking League Table
By Number of Transactions:
| Placement Agent Name | Transaction Count | Total Amount Placed |
| H.C. Wainwright & Co., LLC | 40 | $ 822,757,159 |
| Roth Capital Partners, LLC | 35 | $ 917,519,095 |
| Cowen and Company, LLC | 27 | $ 1,059,739,158 |
| Maxim Group LLC | 24 | $ 500,553,176 |
| Craig-Hallum Capital Group LLC | 20 | $ 344,943,832 |
| Canaccord Genuity Inc. (US) | 18 | $ 744,602,682 |
| Chardan Capital Markets | 14 | $ 208,567,713 |
| Northland Securities, Inc. | 13 | $ 120,081,929 |
| Stifel Nicolaus Weisel | 12 | $ 445,569,237 |
| Jefferies & Company, Inc. | 11 | $ 853,332,207 |
| Barclays Capital, Inc. | 10 | $ 1,079,119,500 |
| JMP Securities LLC | 10 | $ 736,168,507 |
| Piper Jaffray & Co. | 10 | $ 656,749,261 |
| Ladenburg Thalmann & Co., Inc. | 10 | $ 528,331,696 |
| Oppenheimer & Co. Inc. | 10 | $ 466,440,393 |
| Aegis Capital Corporation | 10 | $ 177,385,688 |
| Laidlaw & Company (UK) Ltd. | 10 | $ 93,058,902 |
| Needham & Company, LLC | 9 | $ 533,111,330 |
| National Securities Corporation | 8 | $ 116,067,220 |
| Dawson James Securities, Inc. | 8 | $ 80,029,543 |
| RBC Capital Markets, Inc. | 7 | $ 637,867,685 |
| Brean Capital, LLC | 7 | $ 207,126,569 |
| Palladium Capital Advisors, LLC | 7 | $ 28,534,691 |
| William Blair & Company, LLC | 6 | $ 201,756,291 |
| Leerink Swann, LLC | 5 | $ 353,501,738 |
Investment Banking rankings exclude all 144-A Offerings, Equity Lines of Credit, At the Market Transactions, Rights Offerings, Bought Deals, and all PIPE transactions conducted by foreign issuers that trade in the U.S. on the Pink Sheets. On transactions where an investment banking firm has acted solely as Financial Advisor, that transaction has been excluded from that firm's ranking. Co-agented transactions award full transaction credit to all agents participating (regardless of status of lead agent or co-agent). Data is for closed and definitive agreement transactions reported as of 10/03/14.
The Q3 2014 U.S. PIPE Market
Investment Banking League Table
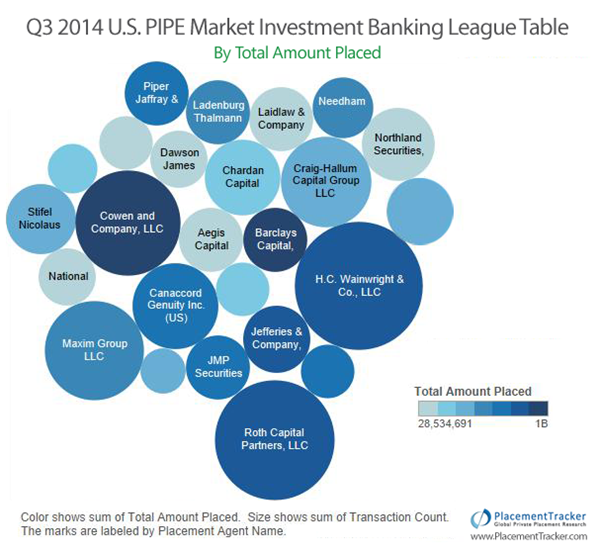
By Total Amount Placed:
| Placement Agent Name | Transaction Count | Total Amount Placed |
| Bank of America Merrill Lynch | 2 | $ 3,545,012,502 |
| Morgan Stanley & Co. International plc | 1 | $ 3,441,512,502 |
| Citigroup Global Markets Limited | 1 | $ 3,441,512,502 |
| Goldman Sachs International | 1 | $ 3,441,512,502 |
| HSBC Bank plc | 1 | $ 3,441,512,502 |
| UBS Limited | 1 | $ 3,441,512,502 |
| Mediobanca-Banca di Credito Finanziario S.p.A | 1 | $ 3,441,512,502 |
| Morgan Stanley | 3 | $ 1,245,000,000 |
| Barclays Capital, Inc. | 10 | $ 1,079,119,500 |
| Cowen and Company, LLC | 27 | $ 1,059,739,158 |
| Deutsche Bank AG, Singapore Branch | 1 | $ 1,000,000,000 |
| Roth Capital Partners, LLC | 35 | $ 917,519,095 |
| Jefferies & Company, Inc. | 11 | $ 853,332,207 |
| H.C. Wainwright & Co., LLC | 40 | $ 822,757,159 |
| Canaccord Genuity Inc. (US) | 18 | $ 744,602,682 |
| JMP Securities LLC | 10 | $ 736,168,507 |
| Piper Jaffray & Co. | 10 | $ 656,749,261 |
| RBC Capital Markets, Inc. | 7 | $ 637,867,685 |
| J.P. Morgan Chase & Co. | 4 | $ 556,997,435 |
| Needham & Company, LLC | 9 | $ 533,111,330 |
| Ladenburg Thalmann & Co., Inc. | 10 | $ 528,331,696 |
| RS Platou Markets AS | 3 | $ 527,250,006 |
| Maxim Group LLC | 24 | $ 500,553,176 |
| Oppenheimer & Co. Inc. | 10 | $ 466,440,393 |
| Deutsche Bank Securities, Inc. | 3 | $ 450,158,750 |
Investment Banking rankings exclude all 144-A Offerings, Equity Lines of Credit, At the Market Transactions, Rights Offerings, Bought Deals, and all PIPE transactions conducted by foreign issuers that trade in the U.S. on the Pink Sheets. On transactions where an investment banking firm has acted solely as Financial Advisor, that transaction has been excluded from that firm's ranking. Co-agented transactions award full transaction credit to all agents participating (regardless of status of lead agent or co-agent). Data is for closed and definitive agreement transactions reported as of 10/03/14.
The Q3 2014 U.S. PIPE Market
Institutional Investor League Table
By Number of Transactions:
| Investor Name | Transaction Count | Total Amount Invested |
| Millennium Management, LLC | 39 | $ 1,000,000 |
| Citadel Advisors, LLC | 36 | Not Disclosed |
| Sabby Management, LLC | 35 | $ 68,478,940 |
| Bank of New York | 27 | Not Disclosed |
| Perceptive Advisors, LLC | 20 | $ 12,256,118 |
| Fidelity Management & Research Corporation | 19 | Not Disclosed |
| Group One Trading, L.P. | 19 | Not Disclosed |
| Heights Capital Management, Inc. | 18 | $ 23,956,589 |
| Broadfin Capital, LLC | 18 | $ 17,155,189 |
| Downsview Capital, Inc. | 18 | $ 13,786,972 |
| Hudson Bay Capital Management L.P. | 16 | $ 64,095,400 |
| Empery Asset Management LP | 16 | $ 28,334,782 |
| D.E. Shaw & Co., L.P. | 16 | Not Disclosed |
| UBS O'Connor LLC | 15 | $ 1,500,000 |
| Deerfield Management | 14 | $ 163,499,998 |
| Equitec Group, LLC | 14 | $ 3,162,335 |
| Wellington Management Company LLP | 12 | $ 74,450,566 |
| LH Financial Services Corporation | 12 | $ 15,064,894 |
| AWM Investment Management (MGP Advisors, LLC) | 12 | $ 4,607,840 |
| Brio Capital Management LLC | 12 | $ 3,793,751 |
| DAFNA Capital Management, LLC | 11 | $ 6,466,910 |
| Alyeska Investment Group, L.P. | 11 | $ 2,000,000 |
| S.A.C. Capital Advisors, LLC | 11 | Not Disclosed |
| Baker Brothers Advisors, LLC | 10 | $ 17,000,006 |
| Whitebox Advisors, LLC | 9 | $ 57,438,329 |
Investor rankings exclude all 144-A Offerings, Equity Lines of Credit, At the Market Transactions, Rights Offerings, Bought Deals, and all PIPE transactions conducted by foreign issuers that trade in the U.S. on the Pink Sheets. Investors classified as Corporate Investors and Insurance Companies have been excluded from this ranking. Data is for closed and definitive agreement transactions reported as of 10/03/14.
The Q3 2014 PIPE Market
Issuer Counsel League Table
By Number of Transactions:
| Legal Counsel | Transaction Count | Total Amount Advised |
| Sichenzia Ross Friedman Ference, LLP | 23 | $ 141,689,779 |
| Mintz, Levin, Cohn, Ferris, Glovsky & Popeo, PC | 15 | $ 246,686,915 |
| Cooley LLP | 14 | $ 590,074,045 |
| DLA Piper | 11 | $ 257,189,453 |
| Goodwin Procter, LLP | 8 | $ 219,178,767 |
| Latham & Watkins, LLP | 7 | $ 1,320,127,708 |
| Skadden, Arps, Slate, Meagher & Flom, LLP | 7 | $ 521,121,919 |
| Seward & Kissel LLP | 7 | $ 212,701,249 |
| Greenberg Traurig, LLP | 7 | $ 58,828,838 |
| Wilmer Cutler Pickering Hale & Dorr, LLP | 6 | $ 680,836,357 |
| Ropes & Gray | 6 | $ 187,938,312 |
| Morrison & Foerster, LLP | 6 | $ 136,635,009 |
| Ellenoff Grossman & Schole LLP | 6 | $ 83,921,679 |
| Weintraub Tobin Chediak Coleman Grodin | 6 | $ 41,331,412 |
| Dorsey & Whitney, LLP | 6 | $ 31,130,250 |
| Davis Graham & Stubbs, LLP | 6 | $ 29,491,759 |
| Paul Hastings LLP | 5 | $ 83,799,990 |
| Lowenstein Sandler, PC | 5 | $ 65,001,875 |
| Robinson Brog Leinwand Greene Genovese & Gluck P.C. | 5 | $ 63,102,653 |
| Nason Yeager Gerson White & Lioce, P.A. | 5 | $ 12,154,965 |
| Loeb & Loeb, LLP | 5 | $ 11,629,197 |
| Szaferman Lakind Blumstein & Blader, PC | 5 | $ 10,850,500 |
| Cravath, Swaine & Moore | 4 | $ 563,750,001 |
| Reeder & Simpson P.C. | 4 | $ 445,250,004 |
| Troutman Sanders, LLP | 4 | $ 194,020,375 |
Legal counsel rankings exclude all 144-A Offerings, Equity Lines of Credit, At the Market Transactions, Rights Offerings, Bought Deals, and all PIPE transactions conducted by foreign issuers that trade in the U.S. on the Pink Sheets. Data is for closed and definitive agreement transactions reported as of 10/03/14.
The Q3 2014 PIPE Market
Investor Counsel League Table
By Number of Transactions:
| Legal Counsel | Transaction Count | Total Amount Advised |
| Schulte Roth & Zabel, LLP | 55 | $ 2,135,878,282 |
| Greenberg Traurig, LLP | 14 | $ 237,074,952 |
| Ellenoff Grossman & Schole LLP | 9 | $ 20,124,918 |
| Sichenzia Ross Friedman Ference, LLP | 5 | $ 35,717,917 |
| Ropes & Gray | 4 | $ 147,731,564 |
| Mintz, Levin, Cohn, Ferris, Glovsky & Popeo, PC | 4 | $ 24,280,000 |
| Brown Rudnick LLP | 3 | $ 61,900,000 |
| Lowenstein Sandler, PC | 3 | $ 60,682,740 |
| Grushko & Mittman, PC | 3 | $ 5,500,000 |
| Skadden, Arps, Slate, Meagher & Flom, LLP | 2 | $ 2,038,473,602 |
| Simpson Thacher Bartlett, LLP | 2 | $ 1,198,000,000 |
| Latham & Watkins, LLP | 2 | $ 416,249,997 |
| Akin, Gump, Strauss, Hauer & Feld, LLP | 2 | $ 319,999,944 |
| Norton Rose Fulbright | 2 | $ 32,302,396 |
| Winston & Strawn | 2 | $ 26,250,000 |
| Goodwin Procter, LLP | 2 | $ 10,000,000 |
| Hansen Black Anderson Ashcraft PLLC | 2 | $ 2,500,000 |
| O'Melveny & Myers, LLP | 1 | $ 700,000,000 |
| Torys, LLP | 1 | $ 700,000,000 |
| Weil, Gotshal & Manges, LLP | 1 | $ 700,000,000 |
| Sullivan & Worcester, LLP | 1 | $ 682,000,000 |
| Cleary, Gottlieb, Steen & Hamilton | 1 | $ 500,000,010 |
| Debevoise & Plimpton, LLP | 1 | $ 500,000,000 |
| Holland & Hart, LLP | 1 | $ 119,291,349 |
| Vinson & Elkins, LLP | 1 | $ 98,000,000 |
Legal counsel rankings exclude all 144-A Offerings, Equity Lines of Credit, At the Market Transactions, Rights Offerings, Bought Deals, and all PIPE transactions conducted by foreign issuers that trade in the U.S. on the Pink Sheets. Data is for closed and definitive agreement transactions reported as of 10/03/14.
The Q3 2014 PIPE Market
Placement Agent Counsel League Table
By Number of Transactions:
| Legal Counsel | Transaction Count | Total Amount Advised |
| Ellenoff Grossman & Schole LLP | 45 | $ 518,712,490 |
| Goodwin Procter, LLP | 25 | $ 883,184,816 |
| Lowenstein Sandler, PC | 12 | $ 207,531,154 |
| Proskauer Rose, LLP | 9 | $ 287,328,126 |
| Latham & Watkins, LLP | 8 | $ 728,622,680 |
| Stikeman Elliott LLP | 7 | $ 151,171,305 |
| Sichenzia Ross Friedman Ference, LLP | 7 | $ 54,593,601 |
| Choate, Hall & Stewart, LLP | 6 | $ 74,758,375 |
| Faegre Baker Daniels LLP | 6 | $ 26,800,608 |
| Mintz, Levin, Cohn, Ferris, Glovsky & Popeo, PC | 4 | $ 120,610,875 |
| Blank Rome LLP | 4 | $ 71,538,838 |
| Fried, Frank, Harris, Shriver & Jacobson | 3 | $ 415,750,006 |
| Pillsbury, Winthrop, Shaw & Pittman, LLP | 3 | $ 376,628,705 |
| Covington & Burling | 3 | $ 195,847,207 |
| Morrison & Foerster, LLP | 3 | $ 119,855,013 |
| Reed Smith, LLP | 3 | $ 33,349,250 |
| Schiff Hardin, LLP | 3 | $ 23,579,521 |
| Dechert, LLP | 2 | $ 103,356,362 |
| Skadden, Arps, Slate, Meagher & Flom, LLP | 2 | $ 60,030,000 |
| Nixon Peabody, LLP | 2 | $ 49,287,000 |
| Faegre & Benson, LLP | 2 | $ 20,107,875 |
| Loeb & Loeb, LLP | 2 | $ 18,413,500 |
| Schiff Hardin & Waite | 2 | $ 17,753,904 |
| Duane Morris, LLP | 2 | $ 14,888,720 |
| K&L Gates LLP | 1 | $ 14,676,558 |
Legal counsel rankings exclude all 144-A Offerings, Equity Lines of Credit, At the Market Transactions, Rights Offerings, Bought Deals, and all PIPE transactions conducted by foreign issuers that trade in the U.S. on the Pink Sheets. Data is for closed and definitive agreement transactions reported as of 10/03/14.
About PlacementTracker
PlacementTracker, a flagship product of Sagient
Research Systems, is well recognized as the leading provider of
research, data and analytics on the PIPE market (Private Investment
in Public Equity). With data on every private placement since
January 1, 1995, PlacementTracker's web-based platform provides
subscribers with an easy to use, comprehensive means to: evaluate
PIPE transactions & investors, perform quick transaction
pricing, identify potential issuers and investors, and compile
comparable transaction, investor & agent statistics.
PlacementTracker's dynamically updating League Tables are available
online at: http://www.placementtracker.com/leaguetables.cfm.
About Sagient Research Systems
Sagient Research Systems is a publisher of specialized research and
data. They develop and sell proprietary research products to global
enterprises, including investment banks, mutual and hedge funds,
pharmaceutical companies, academic institutions, and government
agencies. In each of 2007, 2008, 2009, 2010, and 2012 Sagient
Research was named to the Inc. 5000 list of fastest growing
companies.
For more information, please visit the Sagient Research Systems website at www.sagientresearch.com.
A photo accompanying this release is available at:
http://www.globenewswire.com/newsroom/prs/?pkgid=28251