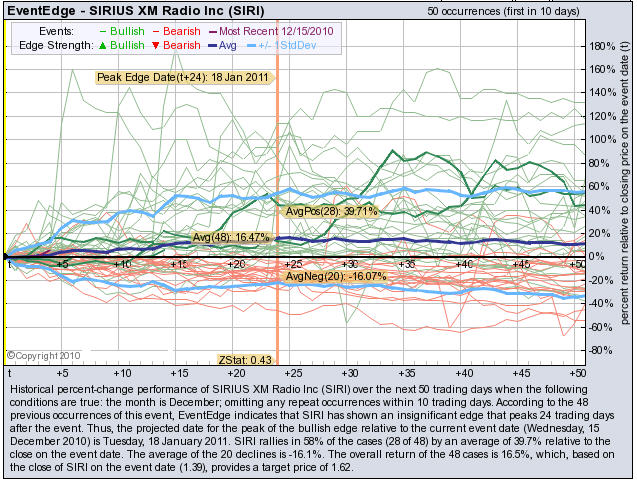
NEWPORT BEACH, Calif., Dec. 22, 2010 (GLOBE NEWSWIRE) -- BUYINS.NET, www.buyins.net , a provider of unique trading technologies, ran a reverse engineering trading scan on SIRIUS XM Radio (Nasdaq:SIRI) on December 15, 2010 after the market closed. The scan predicted SIRI would go 39.7% higher by January 18, 2011 because trading conditions similar to those on or around December 15th had occurred 48 times in the past and 28 times (58%) the stock rose an average of 39.7% within 24 trading days.
Click here to see a chart showing trading patterns after the previous earnings reports:
http://www.buyins.com/images/sirievent12-22-10.jpg
As of December 22nd SIRI has risen 14.38% ($1.39 to $1.59) since the December 15th event prediction. If SIRI fulfills the entire 39.7% gain, the price target would be $1.94.
The movement of stock prices in the days and weeks leading to and following a variety of technical and fundamental trading events may follow a predictable pattern. Most companies' stock price histories show random or unpredictable movements around these events. But some seem to repeat the same pattern quarter after quarter, year after year. The specific technology used to make these predictions is available for a low monthly fee at
http://www.squeezetrigger.com/services/strat/mh.php
About BUYINS.NET
BUYINS.NET, www.buyins.net , monitors trading in all U.S. stocks in real time and maintains massive databases of short sale and naked short sale time and sales data, short squeeze SqueezeTrigger prices, market-maker price movements, shareholder data, statistical data on earnings, sector correlation, seasonality, hedge fund trading strategies, comparable valuations. Reports include:
REGULATORY & COMPLIANCE NEWS
Friction Factor -- market-maker surveillance system tracking Level II market-makers in all stocks to determine Price Friction and compliance with new "Fair Market-Making Requirements"
RegSHO Naked Shorts -- tracks EVERY failure to deliver in all U.S. stocks and tracks all Threshold Security Lists daily for which stocks have naked shorts that are not in compliance with Regulation SHO
INVESTMENTS & TRADING
SqueezeTrigger -- 29 billion cell database tracks EVERY short sale (not just total short interest) in all U.S. stocks and calculates volume weighted price that a short squeeze will begin in each stock.
Earnings Edge -- predicts probability, price move and length of move before and after all U.S. stock earnings reports.
Seasonality -- predicts probability, price move and length of move based on exact time of year for all U.S. stocks.
Group Trader -- tracks sector rotation and stock correlation to its sector and predicts future moves in ALL sectors and industry groups.
Pattern Scan -- tracks all technicals.
DISCLAIMER:
BUYINS.NET is not a registered investment advisor and nothing contained in any materials should be construed as a recommendation to buy or sell any securities. BUYINS.NET has not been compensated by anyone for this report. Past performance is not indicative of future results. Please visit our web site, www.buyins.net , for complete risks and disclosures.