TRUCKEE, CA--(Marketwire - Dec 4, 2012) - Clear Capital (www.clearcapital.com), the premium provider of data, collateral risk assessment, and real estate asset valuation and analytics, today released its Home Data Index™ (HDI) Market Report with data through November 2012. The HDI Market Report uses a broad array of public and proprietary data sources providing the most timely and relevant analysis available.
Report highlights include:
- As the fiscal cliff draws closer, 2012's housing market momentum is most at risk.
- Price gains across markets started to soften in November. The effects of winter are unfolding, but REO saturation trends don't yet sound alarms.
- Lowest performing metro markets could be the canary in the gold mine, signaling the recovery is not yet immune to seasonal slowdowns or fiscal constraints.
"November housing trends hinted at a winter slowdown ahead," said Dr. Alex Villacorta, Director of Research and Analytics at Clear Capital. "While short term growth across the country generally slowed, the housing market has built good momentum over the last year. As previously reported, these gains coupled with reduced rates of REO saturation signal housing should be strong enough to ride out winter, barring any shocks. That said, we remain very concerned about the fiscal cliff given both the threat of uncertainty and the potential for fiscal constraint moving forward.
"If the cliff becomes a reality, we expect to see a pull back in housing. Faced with higher taxes, many potential homebuyers on the fence could very well be forced to rent. While affordability across the country remains a draw for demand, we've already seen it come down off the highs as prices rise. And at the end of the day, going over the cliff translates to reduced net income for potential buyers. Even if prices remain attractive, taking a hit on income will surely deter some demand at a time when markets need it the most."
November Housing Trends: The first signs of winter or the first signs of uncertainty?
National quarterly price gains were more than halved in November over the month, coming in at just 1.0%. While a slowdown in growth is typical in the winter due to fewer fair market sellers listing their homes, the percentage of REO sales held steady at 18.4%. Should the rate of distressed sales hold steady over the next several months, downward price pressure should be minimal.
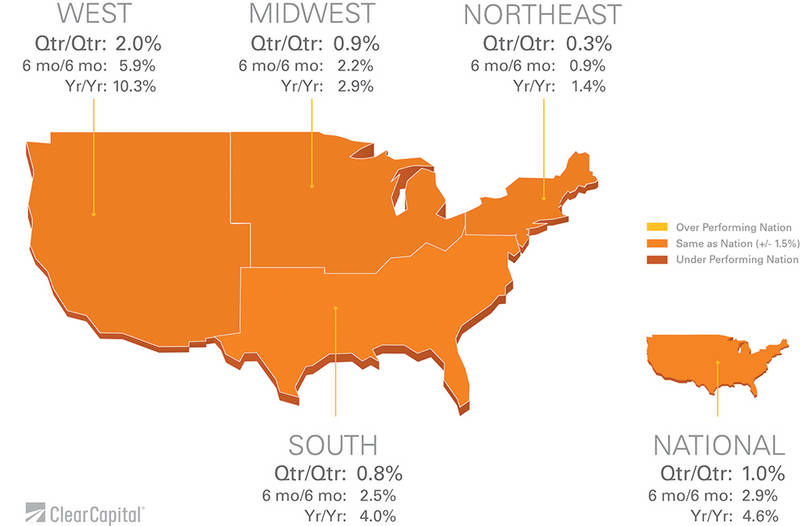
The seasonal effects of winter also started to take hold in three out of four regions. A pull back in growth at similar magnitudes was echoed in the West, South, and Northeast, with quarterly gains of 2.0%, 0.8%, and 0.3%, respectively.
The Midwest was the only region to hold the momentum of quarterly growth over October. However, at just 0.9%, the region is in line with the level of growth across the regions and at the national level.
Price gain stalls are not as evident in yearly price trends. National yearly home prices in November held their ground with 4.6% growth. Putting the recovery into perspective, this time last year, national home prices had declined 2.8%. The South also mostly held its ground, with gains of 4.0% over the last year.
The West continued to lead the recovery, yet with softer yearly gains of 10.3% in November, over October's yearly growth of 11.4%. The region continued to make progress in that REO saturation declined to just 17.8%. Since the peak in 2009, REO saturation has fallen by more than half.
The Northeast posted just 1.4% growth year-over-year, constrained by nearly flat quarterly gains. The region also saw price trends flat in the top tier sector, or homes selling for $423,000 and more.
The Midwest bucked the trend of softening gains, and posted yearly growth of 2.9% in November. While the Midwest hinted at a slowdown in October, things appear to be picking back up. We continue to expect volatility out of the Midwest moving into the deeper winter months. The region typically exhibits price fluctuations, as it represents the lowest median prices of any of the four regions.
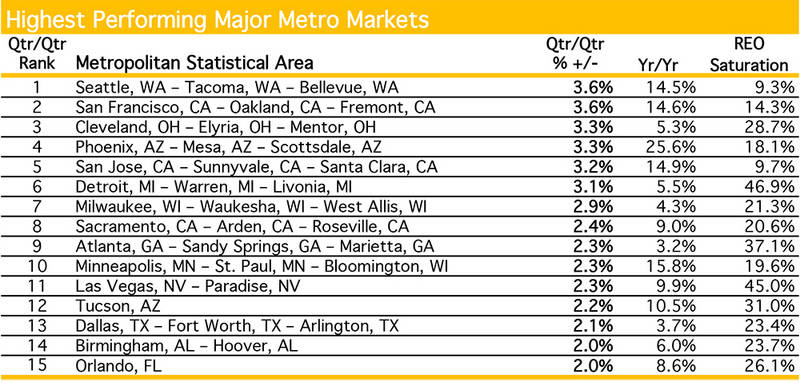
| Highest Performing Major Metro Markets | ||||||||
| Qtr/Qtr Rank |
|
Metropolitan Statistical Area | Qtr/Qtr % +/- |
|
Yr/Yr | REO Saturation | ||
| 1 | Seattle, WA - Tacoma, WA - Bellevue, WA | 3.6% | 14.5% | 9.3% | ||||
| 2 | San Francisco, CA - Oakland, CA - Fremont, CA | 3.6% | 14.6% | 14.3% | ||||
| 3 | Cleveland, OH - Elyria, OH - Mentor, OH | 3.3% | 5.3% | 28.7% | ||||
| 4 | Phoenix, AZ - Mesa, AZ - Scottsdale, AZ | 3.3% | 25.6% | 18.1% | ||||
| 5 | San Jose, CA - Sunnyvale, CA - Santa Clara, CA | 3.2% | 14.9% | 9.7% | ||||
| 6 | Detroit, MI - Warren, MI - Livonia, MI | 3.1% | 5.5% | 46.9% | ||||
| 7 | Milwaukee, WI - Waukesha, WI - West Allis, WI | 2.9% | 4.3% | 21.3% | ||||
| 8 | Sacramento, CA - Arden, CA - Roseville, CA | 2.4% | 9.0% | 20.6% | ||||
| 9 | Atlanta, GA - Sandy Springs, GA - Marietta, GA | 2.3% | 3.2% | 37.1% | ||||
| 10 | Minneapolis, MN - St. Paul, MN - Bloomington, WI | 2.3% | 15.8% | 19.6% | ||||
| 11 | Las Vegas, NV - Paradise, NV | 2.3% | 9.9% | 45.0% | ||||
| 12 | Tucson, AZ | 2.2% | 10.5% | 31.0% | ||||
| 13 | Dallas, TX - Fort Worth, TX - Arlington, TX | 2.1% | 3.7% | 23.4% | ||||
| 14 | Birmingham, AL - Hoover, AL | 2.0% | 6.0% | 23.7% | ||||
| 15 | Orlando, FL | 2.0% | 8.6% | 26.1% | ||||
The highest performing markets exhibited similar trends to those at the national and regional levels, where the range of quarterly gains were reduced by more than half. Yearly price changes continued to be mixed. Average REO saturation for the highest markets of 25.0% in November was 6.6 percentage points higher than the national average. This highlights the true driver behind the recovery: REO segment demand and price gains.
Markets like Detroit, Las Vegas, Tucson, and Atlanta are great examples of markets seeing growth alongside declining, yet relatively high rates of REO saturation.
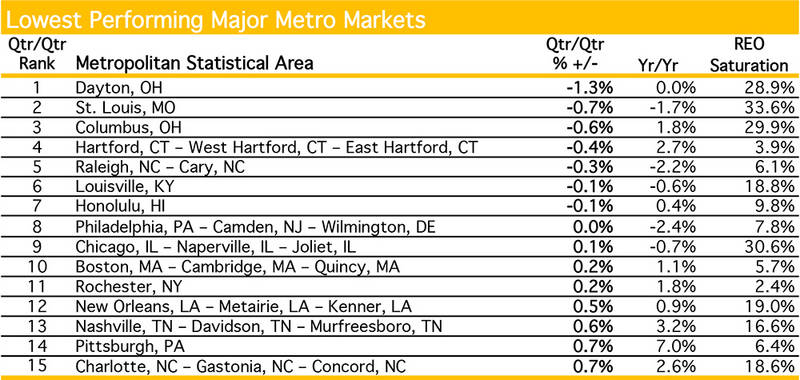
| Lowest Performing Major Metro Markets | ||||||||
| Qtr/Qtr Rank |
Metropolitan Statistical Area | Qtr/Qtr % +/- |
Yr/Yr | REO Saturation | ||||
| 1 | Dayton, OH | -1.3% | 0.0% | 28.9% | ||||
| 2 | St. Louis, MO | -0.7% | -1.7% | 33.6% | ||||
| 3 | Columbus, OH | -0.6% | 1.8% | 29.9% | ||||
| 4 | Hartford, CT - West Hartford, CT - East Hartford, CT | -0.4% | 2.7% | 3.9% | ||||
| 5 | Raleigh, NC - Cary, NC | -0.3% | -2.2% | 6.1% | ||||
| 6 | Louisville, KY | -0.1% | -0.6% | 18.8% | ||||
| 7 | Honolulu, HI | -0.1% | 0.4% | 9.8% | ||||
| 8 | Philadelphia, PA - Camden, NJ - Wilmington, DE | 0.0% | -2.4% | 7.8% | ||||
| 9 | Chicago, IL - Naperville, IL - Joliet, IL | 0.1% | -0.7% | 30.6% | ||||
| 10 | Boston, MA - Cambridge, MA - Quincy, MA | 0.2% | 1.1% | 5.7% | ||||
| 11 | Rochester, NY | 0.2% | 1.8% | 2.4% | ||||
| 12 | New Orleans, LA - Metairie, LA - Kenner, LA | 0.5% | 0.9% | 19.0% | ||||
| 13 | Nashville, TN - Davidson, TN - Murfreesboro, TN | 0.6% | 3.2% | 16.6% | ||||
| 14 | Pittsburgh, PA | 0.7% | 7.0% | 6.4% | ||||
| 15 | Charlotte, NC - Gastonia, NC - Concord, NC | 0.7% | 2.6% | 18.6% | ||||
The lowest performing metro markets started to show signs of weakness in November. Half of the markets posted quarterly losses, yet all but one had declines less than 1.0%. Yearly losses amongst the group were greater in volume and magnitude than the quarterly trends. Five out of 15 markets saw yearly losses, and three markets declined more than 1.5%.
Average REO saturation for the group was at just 15.9%, 2.5 percentage points lower than national, and 9.1 points lower than the average REO saturation of the highest performing metro markets. Again, the trends in REO saturation signal the recovery being led by those markets that were hard hit with relatively high rates of REO saturation continuing to linger. The lowest performing group, on the other hand, is comprised of a handful of markets that haven't seen a lift from their REO segment.
The lowest performing group's pull back serves as a reminder the recovery is not immune to the effects of seasonality, fiscal uncertainty, or notable reductions in income levels. The fiscal cliff remains a threat to consumer confidence and purchasing power as the markets move into the chill of winter.
About the Clear Capital Home Data Index (HDI) Market Report
The Clear Capital HDI Market Report provides insights into market trends and other leading indices for the real estate market at the national and local levels. A critical difference in the value of the HDI Market Report is the capability of Clear Capital to provide more timely and granular reporting than other home price index providers.
The Clear Capital HDI Market Report:
- Offers the real estate industry (investors, lenders, and servicers), government agencies, and the public insight into the most recent pricing conditions, not only at the national and metropolitan level, but within local markets as well.
- Is built on the most recent information available from recorder/assessor offices, and then further enhanced by adding the company's proprietary streaming market data for the most comprehensive geographic coverage and local insights available.
- Reflects nationwide coverage of sales transactions and aggregates this comprehensive dataset at ten different geographic levels, including hundreds of metropolitan statistical areas (MSAs) and sub-ZIP code boundaries.
- Includes equally-weighted distressed bank owned sales (REOs) from around the country to give the most real world look of pricing dynamics across all sales types.
- Allows for the most current market data by providing more frequent updates with patent pending rolling quarter technology. This ensures decisions are based on the most up-to-date information available.
Clear Capital Home Data Index Methodology
- Generates the timeliest indices in patent pending rolling quarter intervals that compare the most recent four months to the previous three months. The rolling quarters have no fixed start date and can be used to generate indices as data flows in, significantly reducing the multi-month lag time experienced with other indices.
- Includes both fair market and institutional (real estate owned) transactions, giving equal weight to all market transactions and identifying price tiers at a market specific level. By giving equal weight to all transactions, the HDI is truly representative of each unique market.
- Results from an address-level cascade create an index with the most granular, statistically significant market area available.
- Provides weighted repeat sales and price-per-square-foot index models that use multiple sale types, including single-family homes, multi-family homes, and condominiums.
About Clear Capital
Clear Capital (www.clearcapital.com) is the premium provider of data and solutions for real estate asset valuation and collateral risk assessment for large financial services companies. Our products include appraisals, broker price opinions, property condition inspections, value reconciliations, automated valuation models, quality assurance services, and home data indices. Clear Capital's combination of progressive technology, high caliber in-house staff, and a well-trained network of more than 40,000 field experts sets a new standard for accurate, up-to-date, and well documented valuation data and assessments. The Company's customers include the largest U.S. banks, investment firms, and other financial organizations.
The information contained in this report is based on sources that are deemed to be reliable; however no representation or warranty is made as to the accuracy, completeness, or fitness for any particular purpose of any information contained herein. This report is not intended as investment advice, and should not be viewed as any guarantee of value, condition, or other attribute.
Contact Information:
Media Contact:
April Moore
Director of Marketing
Clear Capital
530.550.2526
april.moore@clearcapital.com