GREENWICH, CT--(Marketwired - Jul 30, 2013) - Oxford Lane Capital Corp. (
| Investment | Stated Maturity | Manager | NAV %** | ||||
| Venture 2013-3A CLO, Limited Sub Notes | 6/10/2025 | MJX Asset Management LLC | 10.1% | ||||
| ACA CLO 2007-1 - Sub Notes | 6/15/2022 | Apidos Capital Management | 8.6% | ||||
| Carlyle GMS CLO 2013-2, Ltd. Sub Notes | 4/18/2025 | Carlyle Investment Management | 7.2% | ||||
| Carlyle GMS CLO 2011-1 - Sub Notes | 8/10/2021 | Carlyle Investment Management | 5.3% | ||||
| Ares XXVI CLO Ltd. Subordinated Notes | 4/15/2025 | Ares CLO Management | 5.1% | ||||
| AMMC CLO XII, Limited Subordinated Notes | 5/10/2025 | American Money Management Corporation | 4.6% | ||||
| Carlyle GMS CLO 2013-2, Ltd. Class F Notes | 4/18/2025 | Carlyle Investment Management | 4.3% | ||||
| 5180 CLO LP Sub Notes | 5/15/2030 | Guggenheim Investment Management, LLC | 3.8% | ||||
| ACA CLO 2007-1 - Class E Notes | 6/15/2022 | Apidos Capital Management | 3.8% | ||||
| Telos CLO 2013-3, Ltd. Sub Notes | 1/17/2024 | Telos Asset Management LLC | 3.6% | ||||
| Sargas CLO I Ltd - Class D Notes | 8/27/2020 | Sargas Asset Management | 3.5% | ||||
| Neuberger Berman CLO XIII Sub Notes | 1/23/2024 | Neuberger Berman Fixed Income | 3.4% | ||||
| Mountain Capital 2005-4X Class B2L Notes | 3/15/2018 | Mountain Capital Advisors | 3.4% | ||||
| Neuberger Berman CLO XIII Class F Notes | 1/23/2024 | Neuberger Berman Fixed Income | 3.3% | ||||
| Jersey Street CLO Income Notes | 10/20/2018 | MFS Investment Management | 3.3% | ||||
| Harbourview CLO 2006-1 Sub Notes | 12/27/2019 | Harbourview Asset Management Corp | 3.0% | ||||
| ACAS CLO 2013-1A, Ltd. Sub Notes | 4/20/2025 | American Capital Leveraged Finance Mgmt | 2.9% | ||||
| Kingsland V, Ltd. 2007-5X Class E Notes | 7/14/2021 | Kingsland Capital Management | 2.9% | ||||
| Waterfront CLO 2007 - Class D Notes | 8/2/2020 | Grandview Capital Management | 2.7% | ||||
| Emporia III, Ltd. 2007-3A Class E Notes | 4/23/2021 | Emporia Capital Management | 2.4% | ||||
| Octagon XI CLO 2007-1A Income Notes | 8/25/2021 | Octagon Credit Investors | 1.8% | ||||
| Apidos CLO XIV Subordinated Notes | 4/15/2025 | CVC Credit Partners, LLC | 1.8% | ||||
| Octagon XV CLO 2013-1A Income Notes | 1/19/2025 | Octagon Credit Investors | 1.6% | ||||
| GSC VIII - Class D Notes | 4/17/2021 | GSC Acquisition Holdings | 1.5% | ||||
| PPM Grayhawk CLO 2007 - Class D Notes | 4/18/2021 | PPM America | 1.3% | ||||
| Canaras Summit CLO 2007-1 - Income Notes | 6/19/2021 | Canaras Management | 1.2% | ||||
| Hewett's Island CLO IV - Class E Notes | 5/9/2018 | LCM Asset Management | 1.2% | ||||
| Hillmark Funding Ltd. 2006-1A Sub Notes | 5/21/2021 | HillMark Capital Management | 1.1% | ||||
| Sheridan Square CLO Ltd. Sub Notes | 4/15/2025 | GSO/Blackstone Debt Funds Management | 1.0% | ||||
| Gale Force 4 CLO 2007-4A Income Notes | 8/20/2021 | GSO/Blackstone Debt Funds Management | 1.0% | ||||
| Lightpoint CLO VII, Ltd. 2007-7X Sub Notes | 5/15/2021 | LightPoint Capital Management | 0.9% | ||||
| Canaras Summit CLO 2007-1 - Class E Notes | 6/19/2021 | Canaras Management | 0.6% | ||||
Source: Bloomberg L.P. ("Bloomberg")
** NAV % does not equal 100% due to other assets and liabilities on the balance sheet.
Investment Composition
The investments held by the CLO vehicles were primarily in companies domiciled in the United States (approximately 94%1). The top 10 aggregate industry exposures of the CLO vehicles accounted for approximately 55%1 of combined investments while the top 10 aggregate single obligor investments accounted for approximately 3.1%1 (please refer to the following two tables). This results in a weighted average diversity score of 632 for our portfolio (which we believe is broadly comparable to industry diversity scores for other similar CLO vehicles).
| Top Ten Industry Exposures*3 | Ten Largest U.S. Debt Securities3 | |||
| Healthcare, Education & Childcare | 11.4% | Asurion LLC - TL | 0.52% | |
| Telecommunications | 6.5% | Nielsen Finance - TL E | 0.35% | |
| Electronics | 6.3% | Sabre Inc - TL B | 0.33% | |
| Broadcasting and Entertainment | 5.4% | Nuveen Investments - TL B | 0.28% | |
| Retail Stores | 5.2% | Neiman Marcus - Extended TL | 0.27% | |
| Chemicals, Plastics & Rubber | 4.8% | Del Monte - TL | 0.27% | |
| Hotels, Motels, Inns & Gaming | 4.0% | First Data - Extended TL | 0.27% | |
| Automobile | 3.8% | Univar - TL B | 0.27% | |
| Diversified/Conglomerate Services | 3.7% | Convatec Inc - TL | 0.26% | |
| Beverage, Food & Tobacco | 3.6% | KAR Auction Services - TL | 0.25% | |
| Total | 54.6% | Total | 3.07% | |
| Source: Intex Solutions, Inc. ("Intex"). | Source: Intex |
* Reflects industry classifications established by Moody's Investors Service, Inc. ("Moody's")
CLO Compliance
As of June 30, 2013, each of the CLO vehicles was in compliance with all of its respective collateral and coverage tests that were necessary for full payment to be made to the Company by each CLO vehicle.4 The weighted average over-collateralization ("OC") cushion for the Company's CLO equity and debt investments was approximately 3.0% and 8.0%, respectively, as of June 30, 2013 (compared to 2.7% and 7.8%, respectively, as of March 31, 2013). As long as each CLO vehicle maintains a positive OC cushion with respect to the OC test associated with that CLO investment, a full payment is expected to be made to the Company.5
CLO Credit Quality
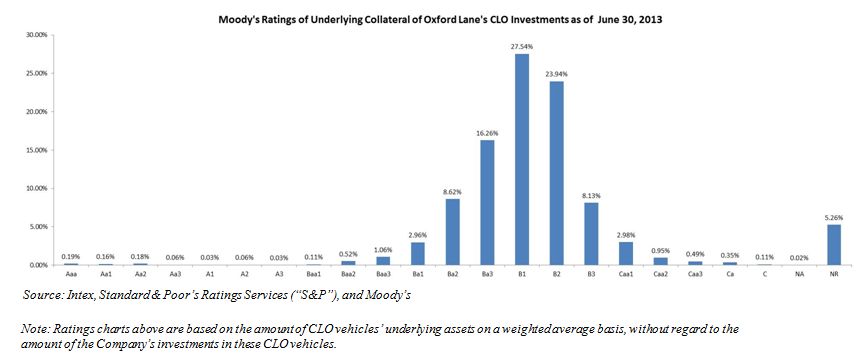
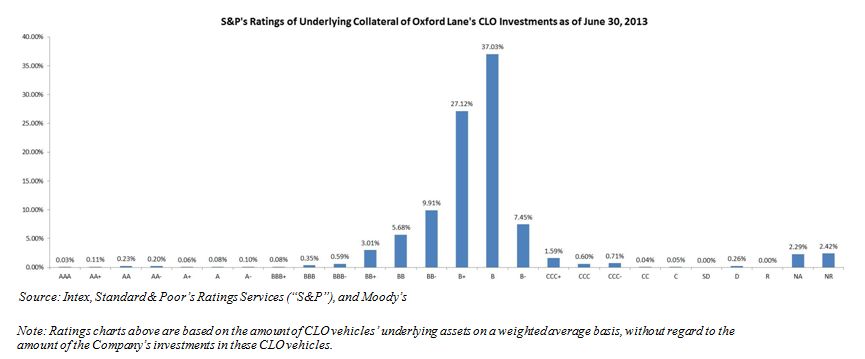
The current weighted average percentage of defaulted securities held by the CLOs (as reported by each CLO) was approximately 0.7% as of June 30, 2013 (compared to 0.9% as of March 31, 2013). The CLO vehicles in which the Company has invested have a weighted average WARF score (Weighted Average Rating Factor) of 2652 as of June 30, 2013 (compared to 2569 as of March 31, 2013) which is equivalent to a Moody's credit rating of between B1 and B2 (see ratings charts below), based on a ratings factor scale provided by Moody's. We believe the weighted average WARF score of our portfolio is broadly comparable to industry WARF scores for other similar CLO vehicles.
Company Financial Highlights
The Company received or was entitled to receive cash interest payments of approximately $653,000 and equity distributions of approximately $4.3 million from its junior debt and equity tranche investments, respectively, for the quarter ending June 30, 2013. These payments represented a quarterly cash return of approximately 1.6% and 4.4% of the junior debt and equity tranche investments at fair value (as of June 30, 2013), respectively, and on a combined basis represented a quarterly cash return of approximately 3.2% of the Company's total portfolio at fair value (as of June 30, 2013). For the quarter ending June 30, 2013, the Company received a full payment from each CLO vehicle (see table below).
| % NAV | |
| Distributions paid by the CLOs for the 3-months ending 6/30/13 | 100.0% |
| Distributions diverted for 3-months ending 6/30/13 | 0.0% |
The approximate weighted average WAS (Weighted Average Spread above LIBOR) for the CLO vehicles in which the Company has an equity investment was 4.3% and the approximate weighted averaged WACC (Weighted Average Cost of Capital above LIBOR) was 1.4%, resulting in approximately a 2.9% margin (before CLO vehicle expenses) as of June 30, 2013 (compared to a weighted average WAS and WACC of 4.1% and 1.4%, respectively, as of March 31, 2013). The weighted average reinvestment end date for the Company's equity positions was February 23, 2016 (with a final legal weighted average maturity date of November 25, 2023) which potentially allows, on a weighted average basis, for approximately 2.5 more years of full equity distribution payments followed by up to approximately 8 years of decreasing distribution payments to the Company, subject to CLO covenant compliance. During the quarter ending June 30, 2013, the Company received a weighted average cash distribution payment on its equity portfolio of approximately 3.5% (of par) with a fair value adjustment of approximately -3.8% (of par) from the prior quarter-end valuations or purchase prices (see table below).6
| Equity Investments | Stated Maturity* | Quarterly Payments for June 2013 as a % of par* | Fair Value Change from 3/31/13 Fair Value or Purchase Price as a % of par | |||
| 5180 CLO LP Sub Notes | 5/15/2030 | 4.5% | 3.0% | |||
| ACA CLO 2007-1 - Sub Notes | 6/15/2022 | 9.7% | -6.0% | |||
| ACAS CLO 2013-1A, Ltd. Sub Notes7 | 4/20/2025 | 0.0% | 0.0% | |||
| AMMC CLO XII, Limited Subordinated Notes7 | 5/10/2025 | 0.0% | 0.0% | |||
| Apidos CLO XIV Subordinated Notes7 | 4/15/2025 | 0.0% | 0.0% | |||
| Ares XXVI CLO Ltd. Subordinated Notes7 | 4/15/2025 | 0.0% | -0.3% | |||
| Canaras Summit CLO 2007-1 - Income Notes | 6/19/2021 | 10.6% | -14.0% | |||
| Carlyle GMS CLO 2013-2, Ltd. Sub Notes7 | 4/18/2025 | 0.0% | 6.8% | |||
| Carlyle GMS CLO 2011-1 - Sub Notes | 8/10/2021 | 8.7% | -18.0% | |||
| Gale Force 4 CLO 2007-4A Income Notes | 8/20/2021 | 8.0% | -13.0% | |||
| Harbourview CLO 2006-1 Sub Notes | 12/27/2019 | 8.9% | -6.0% | |||
| Hillmark Funding Ltd. 2006-1A Sub Notes | 5/21/2021 | 7.0% | 0.0% | |||
| Jersey Street CLO Income Notes | 10/20/2018 | 5.0% | -6.3% | |||
| Lightpoint CLO VII, Ltd. 2007-7X Sub Notes | 5/15/2021 | 7.6% | -10.6% | |||
| Neuberger Berman CLO XIII Sub Notes | 1/23/2024 | 5.3% | -20.0% | |||
| Octagon XI CLO 2007-1A Income Notes | 8/25/2021 | 11.3% | -7.0% | |||
| Octagon XV CLO 2013-1A Income Notes7 | 1/19/2025 | 0.0% | 0.0% | |||
| Sheridan Square CLO Ltd. Sub Notes | 4/15/2025 | 8.8% | -4.0% | |||
| Telos CLO 2013-3, Ltd. Sub Notes7 | 1/17/2024 | 0.0% | 0.0% | |||
| Venture 2013-3A CLO, Limited Sub Notes7 | 6/10/2025 | 0.0% | 0.0% | |||
| Weighted Average | 11/25/2023 | 3.5% | -3.8% | |||
* Source: Bloomberg
Oxford Lane Capital Corp.
Oxford Lane Capital Corp. is a publicly-traded registered closed-end management investment company. It currently seeks to achieve its investment objective of maximizing total return by investing in securitization vehicles which, in turn, primarily invest in senior secured loans made to companies whose debt is rated below investment grade or is unrated.
Forward-Looking Statements
This press release contains forward-looking statements subject to the inherent uncertainties in predicting future results and conditions. Any statements that are not statements of historical fact (including statements containing the words "believes," "plans," "anticipates," "expects," "estimates" and similar expressions) should also be considered to be forward-looking statements. Certain factors could cause actual results and conditions to differ materially from those projected in these forward-looking statements. These factors are identified from time to time in our filings with the Securities and Exchange Commission. We undertake no obligation to update such statements to reflect subsequent events.
Disclaimer
This document has been prepared by the Company and is the sole responsibility of the Company. No liability whatsoever (whether in negligence or otherwise) arising directly or indirectly from the use of this document is accepted and no representation, warranty or undertaking, express or implied, is or will be made by the Company or any of their respective directors, officers, employees, advisers, representatives or other agents ("Agents") for any information or any of the opinions contained herein or for any errors, omissions or misstatements. The Company has relied on certain information provided from Intex, Bloomberg, S&P and Moody's but makes no representation with respect to the accuracy of such information provided by Intex, Bloomberg, S&P or Moody's. Neither the Company nor any of its respective Agents makes or has been authorized to make any representation or warranties (express or implied) in relation to the Company or as to the truth, accuracy or completeness of this document, or any other written or oral statement provided. In particular, no representation or warranty is given as to the achievement or reasonableness of, and no reliance should be placed on any projections, targets, estimates or forecasts contained in this document and nothing in this document is or should be relied on as a promise or representation as to the future.
The Company is subject to significant and variable differences between its accounting income and its taxable income particularly as it relates to its CLO equity investments. The Company invests in CLO entities which generally constitute "passive foreign investment companies" and are subject to complex tax rules; the calculation of taxable income attributed to a CLO equity investment may be materially different from the calculation of income for financial reporting purposes. Taxable income is based upon the distributable share of earnings as determined under tax regulations for each CLO equity investment, while accounting income is currently based upon an effective yield calculation. In general, we currently expect our taxable income to be higher than our reportable accounting income on the basis of actual cash received, and our dividend policy will be based upon our expectations for that taxable income (as is required for a regulated investment company). While reportable accounting income from our CLO equity investments for the quarter ended June 30, 2013 was approximately $3.2 million, we received or were entitled to receive approximately $4.3 million in distributions. Our dividend policy is based upon our estimate of our taxable net investment income, which includes actual distributions from our CLO equity investments.
1 These percentages are based on the amount of CLO vehicles' underlying assets on a weighted average basis, without regard to the amount of the Company's investments in these CLO vehicles.
2 Source: Intex.
3 The percentages for each of the respective tables above are calculated by taking the aggregate amount invested in the industries or debt securities and dividing by the aggregate amount of all of the CLO vehicles' underlying assets (excluding cash), without regard to the amount of the Company's investment in each of these CLO vehicles.
4 The CLO vehicles' indentures have a variety of covenant tests which those CLO vehicles may not be in compliance with in the future should credit markets deteriorate, the loans held by the CLO vehicles fail to make expected payments or otherwise not perform, or for a variety of other reasons. If those covenants are violated, it could result in principal paydowns of the CLO vehicles' higher-rated notes and/or interest diversion which may result in partial or non-payment of the quarterly amounts otherwise due to the Company.
5 Although we expect each of our CLO equity and debt investments to maintain a positive OC cushion through maturity, there can be no assurance that such OC cushions will not be reduced to zero (or the CLO vehicle will not be in violation of the OC tests), either as a result of a deterioration in general economic conditions or other factors specific to the industries or specific companies in which such CLOs have invested. If that were to occur, our ability to receive payments on such CLO investments could be impaired, and we may lose a portion or all of our investment in such CLOs.
6 All calculations in the above paragraph are based on par value.
7 Since this investment was recently purchased in the primary market, the first equity payment is not due until later this year.
Contact Information:
Contact:
Bruce Rubin
203-983-5280