DALLAS, Feb. 13, 2024 (GLOBE NEWSWIRE) -- Beneficient (NASDAQ: BENF) (“Ben” or the “Company”), a technology-enabled financial services holding company that provides liquidity and related trust and custody services to holders of alternative assets, today reported its financial results for the fiscal 2024 third quarter ended December 31, 2023.
Commenting on the fiscal 2024 third quarter, Ben's Chairman and Chief Executive Officer, Brad K. Heppner said, “We continue to make important progress on our mission to transform the alternative asset industry by providing products and services in a fiduciary capacity to marketplace participants.
“This quarter was highlighted: by growth in our Preferred Liquidity Provider Program, which now includes 19 participating funds representing approximately $1.5 billion in committed capital and can serve as a catalyst for a potential expansion of our suite of GP Solutions offerings that seek to meet the needs of General Partners and their limited partner investors; a reduction in our operating expense base by approximately 30%; the continued development of AltAccess to meet customer needs; the launch of a new marketing program designed to scale operations; and other important milestones. We believe we are well positioned for future growth based on our core areas of differentiation, including our fiduciary financial trust company subsidiary, which operates as a regulated fiduciary and our proprietary AltAccess online platform, which delivers our products and services securely to LPs, GPs and their funds and other underserved segments of the private investment marketplace.”
Third Quarter Fiscal 2024 and Recent Highlights (for the quarter ended December 31, 2023 or as noted):
- Reported investments with a fair value of $378.4 million, from $491.9 million at the end of our prior fiscal year, served as collateral for Ben Liquidity's net loan portfolio of $290.8 million and $376.3 million, respectively.
- Grew the GP Preferred Liquidity Provider Program to 19 funds and $1.5 billion in committed capital compared to 7 participating funds with $300 million in committed capital at December 31, 2022
- Operating expenses increased to $905.7 million in 3Q24 compared with $33.8 million in 3Q23, driven by a goodwill impairment of $883.2 million
- Reduced operating expenses by 33% in 3Q24 (excluding non-cash loss on impairment of goodwill), as compared with 3Q23
- Improved financial position with $25 million 3-year term loan
- GP Solutions capability evolved and, subsequent to quarter end, closed $2 million of liquidity financings, capping nearly $10 million sourced from GP Preferred Liquidity Provider Program
“The growing need and demand for our key capabilities is increasingly apparent as the ownership of alternative investments continues to proliferate across mid-to-high net worth individual investors and small-to-midsize institutional investors. To date, other early exit or liquidity solution providers haven’t been able to deliver liquidity to our target market with certainty across three very important dimensions: price, cost, and time. Ben’s AltAccess platform is designed to address each of these issues head on through its ability to seamlessly deliver Ben Liquidity’s products and Ben Custody’s services through our fiduciary financial trust company chartered subsidiary that enables a single-point solution to our customers. Ben Liquidity’s financing of liquidity and capital products and Ben Custody’s custody, trustee and administration services are complementary and operate hand-in-hand. I am optimistic about the role that Ben continues to play in further democratizing the alternative investment industry and unlocking liquidity in alternative assets for individual investors.”
“I’m also excited and encouraged by the initial market reaction to our expanded GP Solutions offering of the GP Primary Commitment Program, through which Ben offers its financing products and other trust services to GPs who are currently fund raising. GPs have increasingly become aware of our GP Solutions offerings over the last quarter and approximately 45% of all GPs we would expect to qualify for participation in this new program responded to our initial marketing outreach related to our GP Solutions offerings and approximately 20% of those GPs indicated they would consider participating in the program. During the upcoming quarters, we will be working to assist these GPs in understanding the program, the program agreements, and, upon final qualification and approvals, delivering the applicable financing and custody and trust administration services to the participating GPs. Any such financings would be expected to be backed by collateral across various asset classes, industry sectors and geographies and, if entered into, would serve to further diversify Ben’s existing loan collateral portfolio across an even wider array of managers while adding to our growing roster of Preferred Liquidity Provider Program partners.
“Today, Ben is able to offer its innovative suite of liquidity products and custody and trust administration services through a substantially reduced operating cost model to bring greater efficiency while maintaining our commitment to innovation and new product offerings that provide swift and secure customer transactions that are subject to regulatory oversight. We believe that our platform and continued execution on our long-term strategic priorities will drive shareholder value and growth as we further build our loan portfolio and secure greater operating cost leverage across our platform,” said Heppner.
Loan Portfolio
As a result of executing on our business plan of providing financing for liquidity, or early investment exits, for alternative asset marketplace participants, Ben organically develops a balance sheet comprised largely of loans collateralized by a well-diversified alternative asset portfolio that is expected to grow as Ben successfully executes on its core business.
At December 31, 2023, Ben’s loan portfolio was supported by a highly diversified alternative asset collateral portfolio providing diversification across more than 250 private market funds and approximately 900 investments across various asset classes, industry sectors and geographies. This portfolio includes exposure to some of the most exciting, sought after private company names worldwide, such as the largest private space exploration company, an innovative software and payment systems provider, a designer and manufacturer of shaving products, a large online store for women's clothes and other fashionable accessories that has announced intentions to go public, a mobile banking services provider, and others.
Figure 1: Portfolio Diversification
Diversification Using Principal Loan Balance, Net of Allowance for Credit Losses
As of December 31, 2023, the charts below present the ExAlt Loan portfolio’s relative exposure by certain characteristics (percentages determined by aggregate fiduciary ExAlt Loan portfolio principal balance net of allowance for credit losses, which includes the exposure to interests in certain of our former affiliates composing part of the Fiduciary Loan Portfolio).
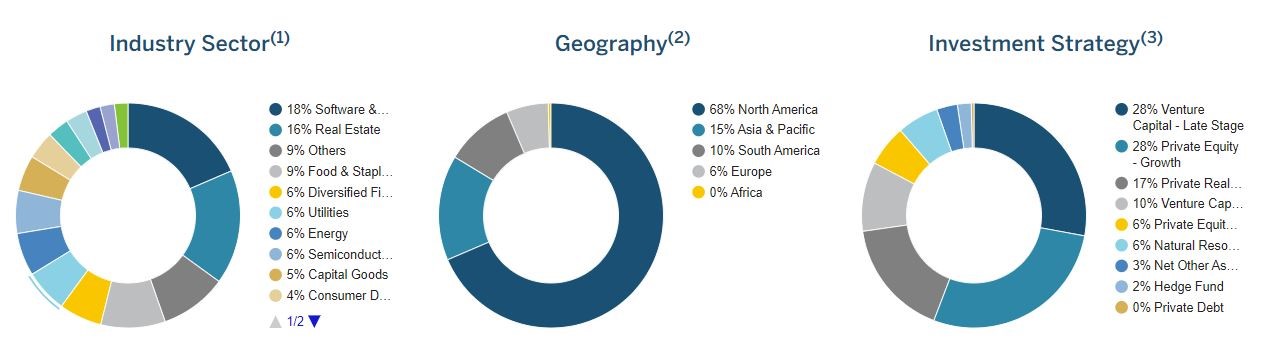
As of December 31, 2023. Represents the characteristics of professionally managed funds and investments in the Collateral (defined as follows) portfolio. The Collateral for the ExAlt Loans in the loan portfolio is comprised of a diverse portfolio of direct and indirect interests (through various investment vehicles, including, limited partnership interests and private and public equity and debt securities, which include our and our affiliates’ or our former affiliates’ securities), primarily in third-party, professionally managed private funds and investments. Loan balances used to calculate the percentages reported in the pie charts are loan balances net of any allowance for credit losses, and as of December 31, 2023, the total allowance for credit losses was $269 million, for a total gross loan balance of $559 million and a loan balance net of allowance for credit losses of $290 million.
Business Segments: Third Quarter Fiscal 2024
Ben Liquidity
Ben Liquidity offers simple, rapid and cost-effective liquidity products through the use of our proprietary financing and trust structure, or the “Customer ExAlt Trusts”, which facilitate the exchange of a Customer’s alternative assets for consideration.
- Ben Liquidity recognized $11.3 million of interest income for the fiscal third quarter, down 13.4% from the quarter ended September 30, 2023, primarily due to lower carrying value of loan receivables, which was driven by higher allowance for credit losses.
- Operating loss for the quarter was $606.4 million, compared to an operating loss of $272.1 million for the quarter ended September 30, 2023. The current quarter operating loss included a non-cash goodwill impairment of $604.7 million and higher interest expense in the current quarter offset partially by lower credit loss adjustments, principally related to securities of our former parent company, in the current quarter.
- Adjusted operating income(1) for the quarter was $2.5 million, compared to adjusted operating loss(1) of $4.7 million in the quarter ended September 30, 2023. The increase was primarily due to lower credit loss adjustments offset partially by additional interest expense, including non-cash amortization of deferred financing costs, related to a new debt facility in the current quarter.
Ben Custody
Ben Custody provides full-service trust and custody administration services to the trustees of certain of the Customer ExAlt Trusts, which own the exchanged alternative assets following liquidity transactions in exchange for fees payable quarterly.
- NAV of alternative assets and other securities held in custody by Ben Custody during the period was $432.5 million, compared to $491.9 million as of March 31, 2023. The decrease was driven by unrealized losses on existing assets, principally related to interests in a wind down trust for a bankrupt entity, and distributions, which was partially offset by new liquidity transactions of Ben Liquidity of $44.4 million during the current fiscal year, representing 9.0% of NAV as of March 31, 2023.
- Revenues applicable to Ben Custody were $5.9 million for the current quarter, compared to $6.5 million for the quarter ended September 30, 2023. The decrease was a result of lower NAV of alternative assets and other securities held in custody.
- Operating loss for the current quarter was $268.0 million, compared to an operating loss of $80.8 million for the quarter ended September 30, 2023. The increase was primarily due to higher non-cash goodwill impairment in the current quarter of $272.8 million as compared to non-cash goodwill impairment of $86.5 million for the quarter ended September 30, 2023.
- Adjusted operating income(1) for the current quarter was $4.8 million, compared to adjusted operating income(1) of $5.6 million for the quarter ended September 30, 2023. The decrease was primarily due to a change in revenue due to lower NAV of alternative assets and other securities held in custody during the current period.
Business Segments: Through Nine Months Ended Fiscal 2024
Ben Liquidity
- Ben Liquidity recognized $36.3 million of interest income for the nine months ended December 31, 2023, down 4.3% compared to the nine months ended December 31, 2022, primarily due to lower loans, net of the allowance for credit losses, resulting from higher levels of non-accrual loans and loan prepayments, partially offset by new loans originated.
- Operating loss was $1.8 billion for the current fiscal year compared to an operating loss of $27.7 million in the prior period. The current period loss was driven by non-cash goodwill impairment totaling $1.7 billion and credit losses largely related to securities of our former parent company.
- Adjusted operating loss(1) was $11.8 million for the nine months ended December 31, 2023 compared to adjusted operating income(1) of $10.2 million in the prior year period with the decrease in adjusted operating income (loss)(1) primarily related to higher credit loss adjustments recognized in the current period and additional interest expense.
- New liquidity transactions closed during the nine months ended December 31, 2023 totaled a NAV of $44.4 million.
Ben Custody
- Ben Custody revenues were $19.0 million for the nine months ended December 31, 2023, down 14.9%, as compared to prior year period due to lower NAV of alternative assets and other securities held in custody.
- Operating loss was $538.8 million for the nine months ended December 31, 2023 compared to operating income of $18.3 million in the prior year period, with the decrease in operating income principally related to non-cash goodwill impairment of $554.6 million in the current period.
- Adjusted operating income(1) for the nine months ended December 31, 2023 was $15.8 million, compared to adjusted operating income(1) of $18.3 million in the prior year period with the decrease in adjusted operating income(1) due to lower revenue related to lower NAV of alternative assets and other securities held in custody and slightly lower professional service expense during the current period.
Capital and Liquidity
- At December 31, 2023, the Company had cash and cash equivalents of $11.2 million and total debt of $128.2 million.
- Distributions received from alternative assets and other securities held in custody totaled $38.4 million for the nine months ended December 31, 2023 compared to $45.4 million for the same period of fiscal 2023.
- Total investments (at fair value) of $378.4 million at December 31, 2023 supported Ben Liquidity's loan portfolio.
(1) Represents a non-GAAP financial measure. For reconciliations of our non-GAAP measures to the most directly comparable GAAP financial measures and for the reasons we believe the non-GAAP measures provide useful information, see Non-GAAP Reconciliations.
Consolidated Fiscal Third Quarter Results
Table 1 below presents a summary of selected unaudited consolidated operating financial information.
| Consolidated Fiscal Third Quarter Results ($ in thousands, except share and per share amounts) | Fiscal 3Q24 December 31, 2023 | Fiscal 2Q24 September 30, 2023 | Fiscal 3Q23 December 31, 2022 | Change % vs. Prior Quarter | YTD Fiscal 2024 | YTD Fiscal 2023 | Change % vs. Prior YTD | |||||||||||||
| GAAP Revenues | $ | (10,235 | ) | $ | (42,761 | ) | $ | (11,444 | ) | 76.1 | % | $ | (55,739 | ) | $ | (86,435 | ) | 35.5 | % | |
| Adjusted Revenues(1) | 8,456 | (801 | ) | 9,036 | NM | 8,478 | (23,391 | ) | NM | |||||||||||
| GAAP Operating Loss | (915,951 | ) | (381,764 | ) | (45,206 | ) | NM | (2,453,685 | ) | (204,157 | ) | NM | ||||||||
| Adjusted Operating Loss(1) | (11,684 | ) | (21,170 | ) | (19,927 | ) | 44.8 | % | (57,374 | ) | (100,998 | ) | 43.2 | % | ||||||
| Diluted Class A EPS | $ | (1.98 | ) | $ | (1.45 | ) | $ | (0.19 | ) | (36.6 | )% | $ | (8.35 | ) | $ | (0.48 | ) | NM | ||
| Segment Revenues attributable to Ben's Equity Holders(2) | 17,961 | 18,629 | 12,048 | (3.6 | )% | 53,715 | 46,687 | 15.1 | % | |||||||||||
| Adjusted Segment Revenues attributable to Ben's Equity Holders(1)(2) | 18,146 | 19,066 | 16,198 | (4.8 | )% | 55,059 | 59,463 | (7.4 | )% | |||||||||||
| Segment Operating Income (Loss) attributable to Ben's Equity Holders | (894,617 | ) | (378,172 | ) | (43,836 | ) | NM | (2,414,893 | ) | (98,544 | ) | NM | ||||||||
| Adjusted Segment Operating Loss attributable to Ben's Equity Holders(1)(2) | $ | (4,594 | ) | $ | (11,960 | ) | $ | (13,769 | ) | 61.6 | % | $ | (37,583 | ) | $ | (20,426 | ) | (84.0 | )% | |
NM - Not meaningful.
(1) Adjusted Revenues, Adjusted Operating Income (Loss), Adjusted Segment Revenues attributable to Ben's Equity Holders and Adjusted Segment Operating Income (Loss) attributable to Ben's Equity Holders are non-GAAP financial measures. For reconciliations of our non-GAAP measures to the most directly comparable GAAP financial measures and for the reasons we believe the non-GAAP measures provide useful information, see Non-GAAP Reconciliations.
(2) Segment financial information attributable to Ben’s equity holders is presented to provide users of our financial information an understanding and visual aide of the segment information (revenues, operating income (loss), and adjusted operating income (loss)) that impacts Ben’s Equity Holders. Ben’s Equity Holders refers to the holders of Beneficient Class A and Class B common stock and Series B-1 Preferred Stock as well as holders of interests in BCH which represent noncontrolling interests. For a description of noncontrolling interests, see Item 2 of our Quarterly Report on Form 10-Q for the nine months ended December 31, 2023, and Reconciliation of Business Segment Information Attributable to Ben’s Equity Holders to Net Income Attributable to Ben Common Holders. Such information is computed as the sum of the Ben Liquidity, Ben Custody and Corp/Other segments since it is the operating results of those segments that determine the net income (loss) attributable to Ben’s Equity Holders. See further information in table 5 and Non-GAAP Reconciliations.
Table 2 below presents a summary of selected unaudited consolidated balance sheet information.
| Consolidated Fiscal Third Quarter Results ($ in thousands) | Fiscal 3Q24 As of December 31, 2023 | Fiscal 4Q23 As of March 31, 2023 | Change % | |||||||
| Investments, at Fair Value | $ | 378,420 | $ | 497,221 | (23.9 | )% | ||||
| All Other Assets | 37,329 | 42,448 | (12.1 | )% | ||||||
| Goodwill and Intangible Assets, Net | 84,814 | 2,371,026 | (96.4 | )% | ||||||
| Total Assets | $ | 500,563 | $ | 2,910,695 | (82.8 | )% | ||||
Business Segment Information Attributable to Ben's Equity Holders(1)
Table 3 below presents unaudited segment revenues and segment operating income (loss) for business segments attributable to Ben's equity holders.
| Segment Revenues Attributable to Ben's Equity Holders(1) ($ in thousands) | Fiscal 3Q24 December 31, 2023 | Fiscal 2Q24 September 30, 2023 | Fiscal 3Q23 December 31, 2022 | Change % vs. Prior Quarter | YTD Fiscal 2024 | YTD Fiscal 2023 | Change % vs. Prior YTD | |||||||||||||
| Ben Liquidity | $ | 11,275 | $ | 13,022 | $ | 12,716 | (13.4 | )% | $ | 36,303 | $ | 37,920 | (4.3 | )% | ||||||
| Ben Custody | 5,897 | 6,490 | 7,216 | (9.1 | )% | 18,961 | 22,280 | (14.9 | )% | |||||||||||
| Corporate & Other | 789 | (883 | ) | (7,884 | ) | NM | (1,549 | ) | (13,513 | ) | 88.5 | % | ||||||||
| Total Segment Revenues Attributable to Ben's Equity Holders(1) | $ | 17,961 | $ | 18,629 | $ | 12,048 | (3.6 | )% | $ | 53,715 | $ | 46,687 | 15.1 | % | ||||||
| Segment Operating Income (Loss) Attributable to Ben's Equity Holders(1) ($ in thousands) | Fiscal 3Q24 December 31, 2023 | Fiscal 2Q24 September 30, 2023 | Fiscal 3Q23 December 31, 2022 | Change % vs. Prior Quarter | YTD Fiscal 2024 | YTD Fiscal 2023 | Change % vs. Prior YTD | |||||||||||||
| Ben Liquidity | $ | (606,405 | ) | $ | (272,091 | ) | $ | (18,997 | ) | NM | $ | (1,781,521 | ) | $ | (27,651 | ) | NM | |||
| Ben Custody | (267,995 | ) | (80,847 | ) | 5,879 | NM | (538,840 | ) | 18,320 | NM | ||||||||||
| Corporate & Other | (20,217 | ) | (25,234 | ) | (30,718 | ) | 19.9 | % | (94,532 | ) | (89,213 | ) | (6.0 | )% | ||||||
| Total Segment Operating Income (Loss) Attributable to Ben's Equity Holders(1) | $ | (894,617 | ) | $ | (378,172 | ) | $ | (43,836 | ) | NM | $ | (2,414,893 | ) | $ | (98,544 | ) | NM | |||
NM - Not meaningful.
(1) Segment financial information attributable to Ben’s equity holders is presented to provide users of our financial information an understanding and visual aide of the segment information (revenues, operating income (loss), and adjusted operating income (loss)) that impacts Ben’s Equity Holders. Ben’s Equity Holders refers to the holders of Beneficient Class A and Class B common stock and Series B-1 Preferred Stock as well as holders of interests in BCH which represent noncontrolling interests. For a description of noncontrolling interests, see Item 2 of our Quarterly Report on Form 10-Q for the nine months ended December 31, 2023, and Reconciliation of Business Segment Information Attributable to Ben’s Equity Holders to Net Income Attributable to Ben Common Holders. Such information is computed as the sum of the Ben Liquidity, Ben Custody and Corp/Other segments since it is the operating results of those segments that determine the net income (loss) attributable to Ben’s Equity Holders. See further information in table 5 and Non-GAAP Reconciliations.
Adjusted Business Segment Information Attributable to Ben's Equity Holders(2)
Table 4 below presents unaudited adjusted segment revenue and adjusted segment operating income (loss) for business segments attributable to Ben's equity holders.
| Adjusted Segment Revenues Attributable to Ben's Equity Holders(1)(2) ($ in thousands) | Fiscal 3Q24 December 31, 2023 | Fiscal 2Q24 September 30, 2023 | Fiscal 3Q23 December 31, 2022 | Change % vs. Prior Quarter | YTD Fiscal 2024 | YTD Fiscal 2023 | Change % vs. Prior YTD | |||||||||||||
| Ben Liquidity | $ | 11,275 | $ | 13,022 | $ | 12,716 | (13.4 | )% | $ | 36,303 | $ | 37,920 | (4.3 | )% | ||||||
| Ben Custody | 5,897 | 6,490 | 7,216 | (9.1 | )% | 18,961 | 22,280 | (14.9 | )% | |||||||||||
| Corporate & Other | 974 | (446 | ) | (3,734 | ) | NM | (205 | ) | (737 | ) | 72.2 | % | ||||||||
| Total Adjusted Segment Revenues Attributable to Ben's Equity Holders(1)(2) | $ | 18,146 | $ | 19,066 | $ | 16,198 | (4.8 | )% | $ | 55,059 | $ | 59,463 | (7.4 | )% | ||||||
| Adjusted Segment Operating Income (Loss) Attributable to Ben's Equity Holders(1)(2) ($ in thousands) | Fiscal 3Q24 December 31, 2023 | Fiscal 2Q24 September 30, 2023 | Fiscal 3Q23 December 31, 2022 | Change % vs. Prior Quarter | YTD Fiscal 2024 | YTD Fiscal 2023 | Change % vs. Prior YTD | |||||||||||||
| Ben Liquidity | $ | 2,525 | $ | (4,738 | ) | $ | 2,121 | NM | $ | (11,769 | ) | $ | 10,183 | NM | ||||||
| Ben Custody | 4,835 | 5,625 | 5,879 | (14.0 | )% | 15,767 | 18,320 | (13.9 | )% | |||||||||||
| Corporate & Other | (11,954 | ) | (12,847 | ) | (21,769 | ) | 7.0 | % | (41,581 | ) | (48,929 | ) | 15.0 | % | ||||||
| Total Adjusted Segment Operating Income (Loss) Attributable to Ben's Equity Holders(1)(2) | $ | (4,594 | ) | $ | (11,960 | ) | $ | (13,769 | ) | 61.6 | % | $ | (37,583 | ) | $ | (20,426 | ) | (84.0 | )% | |
NM - Not meaningful.
(1) Adjusted Revenues, Adjusted Operating Income (Loss), Adjusted Segment Revenues attributable to Ben's Equity Holders and Adjusted Segment Operating Income (Loss) attributable to Ben's Equity Holders are non-GAAP financial measures. For reconciliations of our non-GAAP measures to the most directly comparable GAAP financial measures and for the reasons we believe the non-GAAP measures provide useful information, see Non-GAAP Reconciliations.
(2) Segment financial information attributable to Ben’s equity holders is presented to provide users of our financial information an understanding and visual aide of the segment information (revenues, operating income (loss), and adjusted operating income (loss)) that impacts Ben’s Equity Holders. Ben’s Equity Holders refers to the holders of Beneficient Class A and Class B common stock and Series B-1 Preferred Stock as well as holders of interests in BCH which represent noncontrolling interests. For a description of noncontrolling interests, see Item 2 of our Quarterly Report on Form 10-Q for the nine months ended December 31, 2023, and Reconciliation of Business Segment Information Attributable to Ben’s Equity Holders to Net Income Attributable to Ben Common Holders. Such information is computed as the sum of the Ben Liquidity, Ben Custody and Corp/Other segments since it is the operating results of those segments that determine the net income (loss) attributable to Ben’s Equity Holders. See further information in table 5 and Non-GAAP Reconciliations.
Reconciliation of Business Segment Information Attributable to Ben's Equity Holders to Net Income Attributable to Ben Common Shareholders
Table 5 below presents reconciliation of operating income (loss) by business segment attributable to Ben's Equity Holders to net income (loss) attributable to Ben common shareholders.
| Reconciliation of Business Segments to Net Income (Loss) to Ben Common Shareholders ($ in thousands) | Fiscal 3Q24 December 31, 2023 | Fiscal 2Q24 September 30, 2023 | Fiscal 3Q23 December 31, 2022 | YTD Fiscal 2024 | YTD Fiscal 2023 | |||||||||||
| Ben Liquidity | $ | (606,405 | ) | $ | (272,091 | ) | $ | (18,997 | ) | $ | (1,781,521 | ) | $ | (27,651 | ) | |
| Ben Custody | (267,995 | ) | (80,847 | ) | 5,879 | (538,840 | ) | 18,320 | ||||||||
| Corporate & Other | (20,217 | ) | (25,234 | ) | (30,718 | ) | (94,532 | ) | (89,213 | ) | ||||||
| Less: Loss on debt extinguishment, net (intersegment elimination) | 3,940 | — | — | 3,940 | — | |||||||||||
| Less: Income tax expense | 75 | — | (2,356 | ) | 75 | (1,072 | ) | |||||||||
| Less: Net (income) loss attributable to noncontrolling interests - Ben | 360,695 | 10,604 | 5,887 | 401,985 | 13,231 | |||||||||||
| Less: Net income attributable to noncontrolling interests - CT | — | — | 2,688 | — | (1 | ) | ||||||||||
| Less: Noncontrolling interest guaranteed payment | (4,229 | ) | (4,167 | ) | (3,984 | ) | (12,501 | ) | (11,778 | ) | ||||||
| Net loss attributable to Ben's common shareholders | $ | (542,166 | ) | $ | (371,735 | ) | $ | (36,889 | ) | $ | (2,029,424 | ) | $ | (96,020 | ) | |
Earnings Webcast
Beneficient will host a webcast and conference call to review its third-quarter financial results today, February 13, 2024, at 5:00 pm Eastern time. The webcast will be available via live webcast from the Investor Relations section of the Company’s website at https://shareholders.trustben.com under Events.
Replay
The webcast will be archived on the Company’s website in the investor relations section for replay for at least one year.
About Beneficent
Beneficient (Nasdaq: BENF) – Ben, for short – is on a mission to democratize the global alternative asset investment market by providing traditionally underserved investors − mid-to-high net worth individuals, small-to-midsized institutions and General Partners seeking exit options, financing of anchor commitments and value-added services for their funds − with solutions that could help them unlock the value in their alternative assets. Ben’s AltQuote™ tool provides customers with a range of potential exit options within minutes, while customers can log on to the AltAccess® portal to explore opportunities and receive proposals in a secure online environment.
Its subsidiary, Beneficient Fiduciary Financial, L.L.C., received its charter under the State of Kansas’ Technology-Enabled Fiduciary Financial Institution (TEFFI) Act and is subject to regulatory oversight by the Office of the State Bank Commissioner.
For more information, visit www.trustben.com or follow us on LinkedIn.
Contacts
Investors:
Matt Kreps/214-597-8200/mkreps@darrowir.com
Michael Wetherington/214-284-1199/mwetherington@darrowir.com
investors@beneficient.com
Media:
Longacre Square Partners
Greg Marose / Dan Zacchei
beneficient@longacresquare.com
Disclaimer and Cautionary Note Regarding Forward-Looking Statements
Some of the statements contained in this press release are forward-looking statements within the meaning of Section 27A of the Securities Act of 1933, as amended, and Section 21E of the Securities Exchange Act of 1934, as amended. These forward-looking statements are generally identified by the use of words such as “anticipate,” “believe,” “could,” “estimate,” “expect,” “intend,” “may,” “plan,” “potential,” “predict,” “project,” “should,” “target,” “will,” “would,” and, in each case, their negative or other various or comparable terminology. These forward-looking statements reflect our views with respect to future events as of the date of this document and are based on our management’s current expectations, estimates, forecasts, projections, assumptions, beliefs and information. Although management believes that the expectations reflected in these forward-looking statements are reasonable, it can give no assurance that these expectations will prove to have been correct. All such forward-looking statements are subject to risks and uncertainties, many of which are outside of our control, and could cause future events or results to be materially different from those stated or implied in this document. It is not possible to predict or identify all such risks. These risks include, but are not limited to, our ability to consummate liquidity transactions on terms desirable for the Company, or at all, and the risk factors that are described under the section titled “Risk Factors” in our Annual Report on Form 10-K, Quarterly Reports on Form 10-Q, Current Reports on Form 8-K, and other filings with the Securities and Exchange Commission (the “SEC”). These factors should not be construed as exhaustive and should be read in conjunction with the other cautionary statements that are included in this document and in our SEC filings. We expressly disclaim any obligation to publicly update or review any forward-looking statements, whether as a result of new information, future developments or otherwise, except as required by applicable law.
Table 6: CONSOLIDATED STATEMENTS OF COMPREHENSIVE INCOME (LOSS) (UNAUDITED)
| Three Months Ended December 31, | Nine Months Ended December 31, | ||||||||||||||
| (Dollars in thousands, except per share amounts) | 2023 | 2022 | 2023 | 2022 | |||||||||||
| Revenues | |||||||||||||||
| Investment income (loss), net | $ | 7,448 | $ | 11,478 | $ | 7,935 | $ | (30,738 | ) | ||||||
| Loss on financial instruments, net (related party of $(18,691), $(20,480), $(64,217), and $(63,044), respectively) | (18,024 | ) | (23,043 | ) | (64,260 | ) | (56,101 | ) | |||||||
| Interest and dividend income | 118 | 113 | 348 | 295 | |||||||||||
| Trust services and administration revenues (related party of $8, $8, $23, and $23, respectively) | 158 | 8 | 173 | 23 | |||||||||||
| Other income | 65 | — | 65 | 86 | |||||||||||
| Total revenues | (10,235 | ) | (11,444 | ) | (55,739 | ) | (86,435 | ) | |||||||
| Operating expenses | |||||||||||||||
| Employee compensation and benefits | 7,340 | 12,670 | 58,561 | 34,752 | |||||||||||
| Interest expense (related party of $3,018, $746, $5,843, and $2,108, respectively) | 4,671 | 4,147 | 13,569 | 11,356 | |||||||||||
| Professional services | 4,970 | 8,073 | 22,000 | 29,580 | |||||||||||
| Provision (provision credit) for credit losses | — | 1,799 | — | 20,580 | |||||||||||
| Loss on impairment of goodwill | 883,223 | — | 2,286,212 | — | |||||||||||
| Other expenses (related party of $2,096, $2,246, $6,317, and $6,576, respectively) | 5,512 | 7,073 | 17,604 | 21,454 | |||||||||||
| Total operating expenses | 905,716 | 33,762 | 2,397,946 | 117,722 | |||||||||||
| Operating loss | (915,951 | ) | (45,206 | ) | (2,453,685 | ) | (204,157 | ) | |||||||
| Loss on extinguishment of debt, net | 8,846 | — | 8,846 | — | |||||||||||
| Loss before income taxes | (924,797 | ) | (45,206 | ) | (2,462,531 | ) | (204,157 | ) | |||||||
| Income tax expense (benefit) | 75 | (2,356 | ) | 75 | (1,072 | ) | |||||||||
| Net loss | (924,872 | ) | (42,850 | ) | (2,462,606 | ) | (203,085 | ) | |||||||
| Less: Net (income) loss attributable to noncontrolling interests - Customer ExAlt Trusts | 26,240 | 4,058 | 43,698 | 105,612 | |||||||||||
| Less: Net (income) loss attributable to noncontrolling interests - Ben | 360,695 | 5,887 | 401,985 | 13,231 | |||||||||||
| Less: Noncontrolling interest guaranteed payment | (4,229 | ) | (3,984 | ) | (12,501 | ) | (11,778 | ) | |||||||
| Net loss attributable to Beneficient common shareholders | $ | (542,166 | ) | $ | (36,889 | ) | $ | (2,029,424 | ) | $ | (96,020 | ) | |||
| Other comprehensive income (loss): | |||||||||||||||
| Unrealized gain (loss) on investments in available-for-sale debt securities | 51 | (1,307 | ) | 4,236 | 6,400 | ||||||||||
| Total comprehensive income (loss) | (542,115 | ) | (38,196 | ) | (2,025,188 | ) | (89,620 | ) | |||||||
| Less: comprehensive gain (loss) attributable to noncontrolling interests | 51 | (1,307 | ) | 4,236 | 6,400 | ||||||||||
| Total comprehensive loss attributable to Beneficient | $ | (542,166 | ) | $ | (36,889 | ) | $ | (2,029,424 | ) | $ | (96,020 | ) | |||
| Net loss per common share - basic and diluted(1) | |||||||||||||||
| Class A | $ | (1.98 | ) | $ | (0.19 | ) | $ | (8.35 | ) | $ | (0.48 | ) | |||
| Class B | $ | (1.96 | ) | $ | (0.19 | ) | $ | (7.34 | ) | $ | (0.48 | ) | |||
| Weighted average common shares outstanding - basic and diluted(1) | |||||||||||||||
| Class A | 254,923,039 | 180,178,268 | 226,105,978 | 180,178,268 | |||||||||||
| Class B | 19,140,451 | 19,140,451 | 19,140,451 | 19,140,451 | |||||||||||
(1) Retroactively adjusted the three and nine months ended December 31, 2022 for the de-SPAC merger transaction.
Table 7: CONSOLIDATED STATEMENTS OF FINANCIAL CONDITION
| December 31, 2023 | March 31, 2023(1) | ||||||
| (Dollars and shares in thousands) | (unaudited) | ||||||
| ASSETS | |||||||
| Cash and cash equivalents | $ | 11,248 | $ | 8,726 | |||
| Restricted cash | 20 | 819 | |||||
| Investments, at fair value: | |||||||
| Investments held by Customer ExAlt Trusts (related party of $3,759 and $76,154) | 378,382 | 491,859 | |||||
| Investments held by Ben (related party of $38 and $1,371) | 38 | 5,362 | |||||
| Other assets, net (related party of $0 and $2,195) | 26,061 | 32,903 | |||||
| Intangible assets | 3,100 | 3,100 | |||||
| Goodwill | 81,714 | 2,367,926 | |||||
| Total assets | $ | 500,563 | $ | 2,910,695 | |||
| LIABILITIES, TEMPORARY EQUITY, AND EQUITY | |||||||
| Accounts payable and accrued expenses (related party of $14,032 and $10,485) | $ | 96,194 | $ | 65,724 | |||
| Other liabilities (related party of nil and $100) | 20,986 | 14,622 | |||||
| Warrant liability | 161 | — | |||||
| Customer ExAlt Trusts loan payable, net | — | 52,129 | |||||
| Debt due to related party, net | 128,197 | 99,314 | |||||
| Total liabilities | 245,538 | 231,789 | |||||
| Redeemable noncontrolling interests | |||||||
| Preferred Series A Subclass 0 Unit Accounts, nonunitized | 251,052 | 251,052 | |||||
| Preferred Series A Subclass 1 Unit Accounts, nonunitized | — | 699,441 | |||||
| Total temporary equity | 251,052 | 950,493 | |||||
| Shareholder’s equity: | |||||||
| Preferred stock, par value $0.001 per share, 250,000 shares authorized | |||||||
| Series A Preferred stock, 0 and 0 shares issued and outstanding as of December 31, 2023 and March 31, 2023 | — | — | |||||
| Series B Preferred stock, 0 and 0 shares issued and outstanding as of December 31, 2023 and March 31, 2023 | — | — | |||||
| Class A common stock, par value $0.001 per share, 1,500,000 shares authorized, 257,210 and 180,178 shares issued as of December 31, 2023 and March 31, 2023, respectively, and 256,666 and 179,634 shares outstanding as of December 31, 2023 and March 31, 2023, respectively | 257 | 180 | |||||
| Class B convertible common stock, par value $0.001 per share, 20,000 shares authorized, 19,140 and 19,140 shares issued and outstanding as of December 31, 2023 and March 31, 2023 | 19 | 19 | |||||
| Additional paid-in capital | 1,843,493 | 1,579,545 | |||||
| Accumulated deficit | (1,992,992 | ) | — | ||||
| Stock receivable | (20,038 | ) | — | ||||
| Treasury stock, at cost (544 shares as of December 31, 2023 and March 31, 2023) | (3,444 | ) | (3,444 | ) | |||
| Accumulated other comprehensive income | 442 | 9,900 | |||||
| Noncontrolling interests | 176,236 | 142,213 | |||||
| Total equity | 3,973 | 1,728,413 | |||||
| Total liabilities, temporary equity, and equity | $ | 500,563 | $ | 2,910,695 | |||
(1) Retroactively adjusted March 31, 2023 for the de-SPAC merger transaction. Such adjustments are unaudited.
Table 8: Non-GAAP Reconciliation
| (in thousands) | Three Months Ended December 31, 2023 | ||||||||||||||||||
| Ben Liquidity | Ben Custody | Customer ExAlt Trusts | Corporate/ Other | Consolidating Eliminations | Consolidated | ||||||||||||||
| Total revenues | $ | 11,275 | $ | 5,897 | $ | (11,182 | ) | $ | 789 | $ | (17,014 | ) | $ | (10,235 | ) | ||||
| Mark to market adjustment on interests in the GWG Wind Down Trust | — | — | 18,506 | 185 | — | 18,691 | |||||||||||||
| Adjusted revenues | $ | 11,275 | $ | 5,897 | $ | 7,324 | $ | 974 | $ | (17,014 | ) | $ | 8,456 | ||||||
| Operating income (loss) | $ | (606,405 | ) | $ | (267,995 | ) | $ | (49,363 | ) | $ | (20,217 | ) | $ | 28,029 | $ | (915,951 | ) | ||
| Mark to market adjustment on interests in the GWG Wind Down Trust | — | — | 18,506 | 185 | — | 18,691 | |||||||||||||
| Intersegment reversal of provision for credit losses on collateral comprised of interests in the GWG Wind Down Trust | 4,262 | — | — | — | (4,262 | ) | — | ||||||||||||
| Goodwill impairment | 604,668 | 272,830 | — | 5,725 | — | 883,223 | |||||||||||||
| Share-based compensation expense | — | — | — | 2,026 | — | 2,026 | |||||||||||||
| Legal and professional fees(1) | — | — | — | 327 | — | 327 | |||||||||||||
| Adjusted operating income (loss) | $ | 2,525 | $ | 4,835 | $ | (30,857 | ) | $ | (11,954 | ) | $ | 23,767 | $ | (11,684 | ) | ||||
(1) Includes legal and professional fees related to GWG Holdings bankruptcy, lawsuits, public relations, and employee matters.
| (in thousands) | Three Months Ended September 30, 2023 | ||||||||||||||||||
| Ben Liquidity | Ben Custody | Customer ExAlt Trusts | Corporate/ Other | Consolidating Eliminations | Consolidated | ||||||||||||||
| Total revenues | $ | 13,022 | $ | 6,490 | $ | (41,886 | ) | $ | (883 | ) | $ | (19,504 | ) | $ | (42,761 | ) | |||
| Mark to market adjustment on interests in the GWG Wind Down Trust | — | — | 41,523 | 437 | — | 41,960 | |||||||||||||
| Adjusted revenues | $ | 13,022 | $ | 6,490 | $ | (363 | ) | $ | (446 | ) | $ | (19,504 | ) | $ | (801 | ) | |||
| Operating income (loss) | $ | (272,091 | ) | $ | (80,847 | ) | $ | (78,275 | ) | $ | (25,234 | ) | $ | 74,683 | $ | (381,764 | ) | ||
| Mark to market adjustment on interests in the GWG Wind Down Trust | — | — | 41,523 | 437 | — | 41,960 | |||||||||||||
| Intersegment reversal of provision for credit losses on collateral comprised of interests in the GWG Wind Down Trust | 47,141 | — | — | — | (47,141 | ) | — | ||||||||||||
| Goodwill impairment | 220,212 | 86,472 | — | — | — | 306,684 | |||||||||||||
| Share-based compensation expense | — | — | — | 8,503 | — | 8,503 | |||||||||||||
| Legal and professional fees(1) | — | — | — | 3,447 | — | 3,447 | |||||||||||||
| Adjusted operating income (loss) | $ | (4,738 | ) | $ | 5,625 | $ | (36,752 | ) | $ | (12,847 | ) | $ | 27,542 | $ | (21,170 | ) | |||
(1) Includes legal and professional fees related to GWG Holdings bankruptcy, lawsuits, public relations, and employee matters.
| (in thousands) | Three Months Ended December 31, 2022 | ||||||||||||||||||
| Ben Liquidity | Ben Custody | Customer ExAlt Trusts | Corporate/ Other | Consolidating Eliminations | Consolidated | ||||||||||||||
| Total revenues | $ | 12,716 | $ | 7,216 | $ | (3,568 | ) | $ | (7,884 | ) | $ | (19,924 | ) | $ | (11,444 | ) | |||
| Mark to market adjustment on equity security of related party | — | — | 16,330 | 4,150 | — | 20,480 | |||||||||||||
| Adjusted revenues | $ | 12,716 | $ | 7,216 | $ | 12,762 | $ | (3,734 | ) | $ | (19,924 | ) | $ | 9,036 | |||||
| Operating income (loss) | $ | (18,997 | ) | $ | 5,879 | $ | (41,853 | ) | $ | (30,718 | ) | $ | 40,483 | $ | (45,206 | ) | |||
| Mark to market adjustment on equity security of related party | — | — | 16,330 | 4,150 | — | 20,480 | |||||||||||||
| Intersegment provision for loan losses on collateral comprised of related party equity securities | 21,118 | — | — | — | (21,118 | ) | — | ||||||||||||
| Provision for credit losses related to receivables from related party | — | — | — | 563 | — | 563 | |||||||||||||
| Share-based compensation expense | — | — | — | 1,918 | — | 1,918 | |||||||||||||
| Legal and professional fees(1) | — | — | — | 2,318 | — | 2,318 | |||||||||||||
| Adjusted operating income (loss) | $ | 2,121 | $ | 5,879 | $ | (25,523 | ) | $ | (21,769 | ) | $ | 19,365 | $ | (19,927 | ) | ||||
(1) Includes legal and professional fees related to GWG Holdings bankruptcy, lawsuits, public relations and employee matters.
| (in thousands) | Nine Months Ended December 31, 2023 | |||||||||||||||||||||||
| Ben Liquidity | Ben Custody | Customer ExAlt Trusts | Corporate/ Other | Consolidating Eliminations | Consolidated | |||||||||||||||||||
| Total revenues | $ | 36,303 | $ | 18,961 | $ | (54,363 | ) | $ | (1,549 | ) | $ | (55,091 | ) | $ | (55,739 | ) | ||||||||
| Mark to market adjustment interests in the GWG Wind Down Trust | — | — | 62,873 | 1,344 | — | 64,217 | ||||||||||||||||||
| Adjusted revenues | $ | 36,303 | $ | 18,961 | $ | 8,510 | $ | (205 | ) | $ | (55,091 | ) | $ | 8,478 | ||||||||||
| Operating income (loss) | $ | (1,781,521 | ) | $ | (538,840 | ) | $ | (166,051 | ) | $ | (94,532 | ) | $ | 127,259 | $ | (2,453,685 | ) | |||||||
| Mark to market adjustment interests in the GWG Wind Down Trust | — | — | 62,873 | 1,344 | — | 64,217 | ||||||||||||||||||
| Intersegment provision for credit losses on collateral comprised of interests in the GWG Down Trust | 43,872 | — | — | — | (43,872 | ) | — | |||||||||||||||||
| Goodwill impairment | 1,725,880 | 554,607 | — | 5,725 | — | 2,286,212 | ||||||||||||||||||
| Share-based compensation expense | — | — | — | 37,530 | — | 37,530 | ||||||||||||||||||
| Legal and professional fees(1) | — | — | — | 8,352 | — | 8,352 | ||||||||||||||||||
| Defunct product offering costs | — | — | — | — | — | — | ||||||||||||||||||
| Adjusted operating income (loss) | $ | (11,769 | ) | $ | 15,767 | $ | (103,178 | ) | $ | (41,581 | ) | $ | 83,387 | $ | (57,374 | ) | ||||||||
(1) Includes legal and professional fees related to GWG Holdings bankruptcy, lawsuits, public relations, and employee matters.
| (in thousands) | Nine Months Ended December 31, 2022 | |||||||||||||||||||||||
| Ben Liquidity | Ben Custody | Customer ExAlt Trusts | Corporate/ Other | Consolidating Eliminations | Consolidated | |||||||||||||||||||
| Total revenues | $ | 37,920 | $ | 22,280 | $ | (72,945 | ) | $ | (13,513 | ) | $ | (60,177 | ) | $ | (86,435 | ) | ||||||||
| Mark to market adjustment on equity security of related party | — | — | 50,268 | 12,776 | — | 63,044 | ||||||||||||||||||
| Adjusted revenues | $ | 37,920 | $ | 22,280 | $ | (22,677 | ) | $ | (737 | ) | $ | (60,177 | ) | $ | (23,391 | ) | ||||||||
| Operating income (loss) | $ | (27,651 | ) | $ | 18,320 | $ | (193,974 | ) | $ | (89,213 | ) | $ | 88,361 | $ | (204,157 | ) | ||||||||
| Mark to market adjustment on equity security of related party | — | — | 50,268 | 12,776 | — | 63,044 | ||||||||||||||||||
| Intersegment provision for loan losses on collateral comprised of related party equity securities | 37,834 | — | — | — | (37,834 | ) | — | |||||||||||||||||
| Provision for credit losses related to available-for-sale debt securities of related party | — | — | 12,607 | 14 | — | 12,621 | ||||||||||||||||||
| Provision for credit losses related to receivables from related party | — | — | — | 6,723 | — | 6,723 | ||||||||||||||||||
| Share-based compensation expense | — | — | — | 8,162 | — | 8,162 | ||||||||||||||||||
| Legal and professional fees(1) | — | — | — | 8,795 | — | 8,795 | ||||||||||||||||||
| Defunct product offering costs | — | — | — | 3,814 | — | 3,814 | ||||||||||||||||||
| Adjusted operating income (loss) | $ | 10,183 | $ | 18,320 | $ | (131,099 | ) | $ | (48,929 | ) | $ | 50,527 | $ | (100,998 | ) | |||||||||
(1) Includes legal and professional fees related to GWG Holdings bankruptcy, lawsuits, public relations, and employee matters.
Adjusted Revenues, Adjusted Operating Income (Loss), Adjusted Segment Revenues attributable to Ben's Equity Holders and Adjusted Segment Operating Income (Loss) attributable to Ben's Equity Holders are non-GAAP financial measures. We present these non-GAAP financial measures because we believe it helps investors understand underlying trends in our business and facilitates an understanding of our operating performance from period to period because it facilitates a comparison of our recurring core business operating results. These non-GAAP financial measures are intended as a supplemental measure of our performance that is neither required by, nor presented in accordance with, U.S. GAAP. Our presentation of these measures should not be construed as an inference that our future results will be unaffected by unusual or non-recurring items. Our computation of these non-GAAP financial measures may not be comparable to other similarly titled measures computed by other companies, because all companies may not calculate such items in the same way.
We define adjusted revenues as GAAP revenues adjusted to exclude the effect of mark-to-market adjustments on certain related party equity securities, interest income on related party available-for-sale debt securities, and income from the forfeiture of vested share-based compensation awards. Adjusted Segment Revenues attributable to Ben's Equity Holders is the same as "adjusted revenues" related to the aggregate of the Ben Liquidity, Ben Custody, and Corporate/Other Business Segments, which are the segments that impact the net income (loss) attributable to all equity holders of Beneficient, including equity holders of Beneficient's subsidiary, Beneficient Company Holdings, L.P.
Adjusted operating income (loss) represents GAAP operating income (loss), adjusted to exclude the effect of the adjustments to revenue as described above, credit losses on related party available-for-sale debt securities, and receivables from a related party that filed for bankruptcy, non-cash asset impairment, share-based compensation expense, audit fee normalization, and legal, professional services, and public relations costs related to the GWG Holdings bankruptcy, lawsuits, a defunct product offering, and certain employee matters, including fees incurred in arbitration with a former director. Adjusted Segment Operating Income (Loss) attributable to Ben's Equity Holders is the same as "adjusted operating income (loss)" related to the aggregate of the Ben Liquidity, Ben Custody, and Corporate/Other Business Segments, which are the segments that impact the net income (loss) attributable to all equity holders of Beneficient, including equity holders of Beneficient's subsidiary, Beneficient Company Holdings, L.P.
These non-GAAP financial measures are not a measure of performance or liquidity calculated in accordance with U.S. GAAP. They are unaudited and should not be considered an alternative to, or more meaningful than, GAAP revenues or GAAP operating income (loss) as an indicator of our operating performance. Uses of cash flows that are not reflected in adjusted operating income (loss) or adjusted segment operating income (loss) attributable to Ben's Equity Holders include capital expenditures, interest payments, debt principal repayments, and other expenses, which can be significant. As a result, adjusted operating income (loss) and/or adjusted segment operating income (loss) attributable to Ben's Equity Holders should not be considered as a measure of our liquidity.
Because of these limitations, Adjusted Revenues, Adjusted Operating Income (Loss), Adjusted Segment Revenues attributable to Ben's Equity Holders and Adjusted Segment Operating Income (Loss) attributable to Ben's Equity Holders should not be considered in isolation or as a substitute for performance measures calculated in accordance with U.S. GAAP. We compensate for these limitations by relying primarily on our U.S. GAAP results and using Adjusted Revenues, Adjusted Operating Income (Loss), Adjusted Segment Revenues attributable to Ben's Equity Holders and Adjusted Segment Operating Income (Loss) attributable to Ben's Equity Holders on a supplemental basis. You should review the reconciliation of these non-GAAP financial measures set forth above and not rely on any single financial measure to evaluate our business.
A photo accompanying this announcement is available at https://www.globenewswire.com/NewsRoom/AttachmentNg/84b39125-cd16-443a-8b78-ad91b46c4e7d
