MANISTIQUE, MI--(Marketwire - May 4, 2011) - Mackinac Financial Corporation (NASDAQ: MFNC), the bank holding company for mBank (the "Bank") today announced first quarter 2011 income of $.256 million or $.07 per share compared to net income of $3.526 million, or $1.03 per share for the first quarter of 2010. Operating results for the first quarter of 2010 included the recognition of a $3.500 million deferred tax benefit related to NOL carry-forwards. The Corporation's primary asset, mBank, recorded net income of $.529 million.
Some highlights for the quarter included:
- Nonperforming assets at the end of the first quarter of 2011 totaled $15.045 million, a reduction of $1.080 million from 2010 year end balances.
- In the first quarter of 2011, the corporation did not record a provision for loan losses as compared to the $.900 million provision recorded in the first quarter of 2010.
- ORE write-downs/gains and losses of $.467 million.
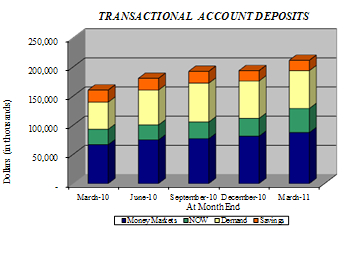
- Core deposit growth of $25.024 million primarily in transactional accounts, accounting for $17.743 million of this growth.
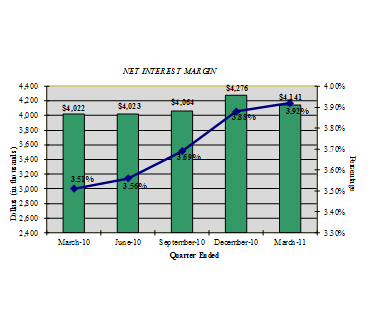
- A stable and improving net interest margin of 3.92% for the quarter.
- SBA/USDA loan sale premium income of $.236 million with a solid pipeline of new loans for sale entering into the second quarter which should enable the company to exceed first quarter totals. We still see premium pricing in the 108% to 110% range on these transactions.
Margin Analysis
Net interest margin in the first quarter of 2011 increased to $4.141 million, 3.92%, compared to $4.022 million, or 3.51%, in the first quarter of 2010. The interest margin increase was largely due to decreased funding costs. Kelly W. George, President and Chief Executive Officer of mBank, stated, "In the first quarter of 2011, we experienced continued margin improvement from decreased rates on deposit funding, increases in low cost transactional accounts, and also our disciplined loan pricing, which can include floor rates with regard to variable rate loans. We expect our margin to improve as we progress through the year with increased funding of new loans and further repayment of maturing brokered deposits."
Loans and Non-performing Assets
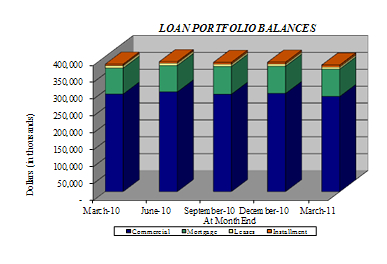
Total loans at March 31, 2011 were $374.609 million, a .72% decrease from the $377.311 million at March 31, 2010 and down $8.477 million from year-end 2010 total loans of $383.086 million. George stated, "Loan growth in the first quarter was impacted by normal principal reduction and pay-downs. The $8.477 million in reductions included $2.384 million in SBA loan sales, and the move of $.800 million of nonperforming loans to OREO, along with a reduction of $1.4 million on another nonperforming loan relationship that was sold. Our first quarter new loan production was satisfactory given the seasonality of our business where the first quarter routinely is the slowest. In the first quarter, we had $16.8 million of production occurring in all regions, including $4.9 million in secondary market mortgage production. Our strongest region was the Upper Peninsula with $11.4 million total production.
The decrease in nonperforming assets in the first quarter is the result of aggressive remediation of nonperforming assets, problem borrowers and related workout programs. George, commenting on credit quality, stated: "We continue to aggressively market our OREO properties and believe our aggressive write-downs reflect current market values, and will result in sales later this year. We remain highly focused on overall asset quality metrics given the still challenging overall Michigan economy but believe that things have begun to stabilize. We are encouraged by our Texas Ratio of 24.96% for the quarter, which is among the lowest of the 15 largest public banks headquartered in Michigan."
Deposits
Total deposits of $400.783 million at March 31, 2011 were down 1.09% from deposits of $405.212 million on March 31, 2010 due to decreased levels of brokered deposits, which declined from $138.812 million on March 31, 2010, to $63.342 million on March 31, 2011. First quarter 2011 deposits were up $14.004 million from year-end 2010 deposits of $386.779 million. The overall increase in deposits for the first quarter of 2011 is comprised of a decrease in noncore deposits of $11.020 million which was offset with increased core deposits of $25.024 million. George, commenting on the increased core deposits, stated, "In the first quarter of 2011, we continued to grow core deposits at a steady rate. We will remain focused on this as a primary strategic objective to reduce our overall dependency on wholesale funding sources for future margin improvements and decreased regulatory costs."
Noninterest Income/Expense
Noninterest income, at $.577 million in the first quarter of 2011, decreased $.230 million from the first quarter 2010 level of $.807 million. Noninterest income in the first quarter of 2010 includes $.215 million of security gains which the Corporation does not consider recurring or core earnings provider. The other most significant decrease for the 2011 first quarter was fees on deposit accounts, due mostly to lower overdraft fees in 2011, a trend that appears to be industry wide given heightened regulatory scrutiny, pending regulations and customers being more aware and diligent in managing their accounts.
Noninterest expense totaled $4.059 million in the first quarter of 2011, an increase of $.430 million, or 11.85% from the first quarter of 2010. Increased expenses in the first quarter continue to reflect the added cost of aggressive nonperforming asset remediation, along with an increase in FDIC insurance premiums of $.063 million. The expenses related to nonperforming assets were primarily write-downs and gains/losses on OREO of $.467 million. The Corporation continues to look for ways to control costs and remains below peer level in terms of salary and benefits and total operating expenses as a percentage of total assets.
Assets and Capital
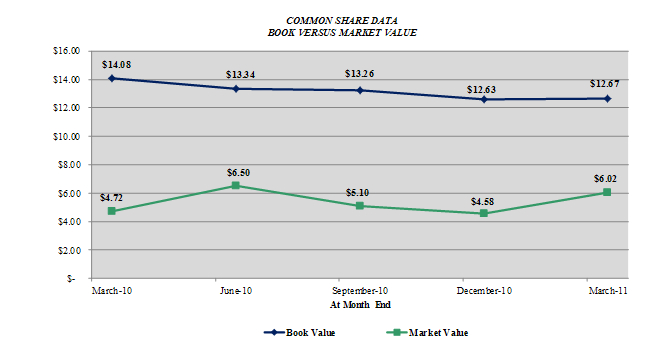
Total assets of the Corporation at March 31, 2011 were $492.790 million, down 1.92% from the $502.427 million reported at March 31, 2010. First quarter 2011 total assets were up 2.94% from the $478.696 million of total assets at year-end 2010. Common Shareholders' equity at March 31, 2011 totaled $43.340 million, or $12.67 per share, compared to $48.160 million, or $14.08 per share on March 31, 2010. The Corporation and the Bank are both "well-capitalized" with Tier 1 Capital at the Corporation of 9.70% and 8.54% at the Bank.
Paul D. Tobias, Chairman and Chief Executive Officer, concluded, "We believe that 2011 will be the year where MFNC begins to demonstrate the earning capability of the franchise as the credit environment and our credit metrics improve. In the 2011 first quarter we experienced good growth in core deposits. We expect good loan growth for the remainder of 2011, which will translate into fee income from sales of SBA/USDA loans, along with good balance sheet growth to enhance our net interest margin. We have also begun to explore the merits of the Small Business Loan Fund as an inexpensive temporary source of capital and a source of repayment of our TARP funding."
Mackinac Financial Corporation is a registered bank holding company formed under the Bank Holding Company Act of 1956 with assets in excess of $490 million and whose common stock is traded on the NASDAQ stock market as "MFNC." The principal subsidiary of the Corporation is mBank. Headquartered in Manistique, Michigan, mBank has 11 branch locations; seven in the Upper Peninsula, three in the Northern Lower Peninsula and one in Oakland County, Michigan. The Company's banking services include commercial lending and treasury management products and services geared toward small to mid-sized businesses, as well as a full array of personal and business deposit products and consumer loans.
Forward-Looking Statements
This release contains certain forward-looking statements. Words such as "anticipates," "believes," "estimates," "expects," "intends," "should," "will," and variations of such words and similar expressions are intended to identify forward-looking statements: as defined by the Private Securities Litigation Reform Act of 1995. These statements reflect management's current beliefs as to expected outcomes of future events and are not guarantees of future performance. These statements involve certain risks, uncertainties and assumptions that are difficult to predict with regard to timing, extent, likelihood, and degree of occurrence. Therefore, actual results and outcomes may materially differ from what may be expressed or forecasted in such forward-looking statements. Factors that could cause a difference include among others: changes in the national and local economies or market conditions; changes in interest rates and banking regulations; the impact of competition from traditional or new sources; and the possibility that anticipated cost savings and revenue enhancements from mergers and acquisitions, bank consolidations, branch closings and other sources may not be fully realized at all or within specified time frames as well as other risks and uncertainties including but not limited to those detailed from time to time in filings of the Company with the Securities and Exchange Commission. These and other factors may cause decisions and actual results to differ materially from current expectations. Mackinac Financial Corporation undertakes no obligation to revise, update, or clarify forward-looking statements to reflect events or conditions after the date of this release.
MACKINAC FINANCIAL CORPORATION AND SUBSIDIARIES
SELECTED FINANCIAL HIGHLIGHTS
(Dollars in thousands, except per share data)
For The Period Ended
----------------------------------
December
March 31, 31, March 31,
2011 2010 2010
---------- ---------- ----------
(Unaudited) (Unaudited)
Selected Financial Condition Data (at
end of period):
Assets $ 492,790 $ 478,696 $ 502,427
Loans 374,609 383,086 377,311
Investment securities 37,543 33,860 36,841
Deposits 400,783 386,779 405,212
Borrowings 36,069 36,069 36,140
Common shareholders' equity 43,340 43,176 48,160
Total shareholders' equity 54,097 53,882 58,722
Selected Statements of Income Data:
Net interest income $ 4,141 $ 16,385 $ 4,022
Income (Loss) before taxes and
preferred dividend 659 (3,918) 300
Net income (Loss) 256 (1,160) 3,526
Income (Loss) per common share - Basic .07 (0.34) 1.03
Income (Loss) per common share -
Diluted .07 (0.34) 1.03
Weighted average shares outstanding 3,419,736 3,419,736 3,419,736
Selected Financial Ratios and Other
Data:
Performance Ratios:
Net interest margin 3.92% 3.66% 3.51%
Efficiency ratio 75.73 72.57 78.12
Return on average assets .22 (0.23) 2.81
Return on average common equity 2.40 (2.54) 32.08
Return on average total equity 1.92 (2.06) 25.95
Average total assets $ 478,861 $ 502,993 $ 508,495
Average common shareholders' equity 43,147 45,568 44,577
Average total shareholders' equity 53,870 56,171 55,109
Average loans to average deposits ratio 98.27% 94.36% 92.93%
Common Share Data (at end of period):
Market price per common share $ 6.02 $ 4.58 $ 4.72
Book value per common share $ 12.67 $ 12.63 $ 14.08
Common shares outstanding 3,419,736 3,419,736 3,419,736
Other Data (at end of period):
Allowance for loan losses $ 6,184 $ 6,613 $ 4,737
Non-performing assets $ 15,045 $ 16,125 $ 17,619
Allowance for loan losses to total
loans 1.65% 1.73% 1.26%
Non-performing assets to total assets 3.05% 3.37% 3.51%
Texas Ratio 24.96% 26.66% 27.75%
Number of:
Branch locations 11 11 10
FTE Employees 108 110 103
MACKINAC FINANCIAL CORPORATION AND SUBSIDIARIES
CONSOLIDATED BALANCE SHEETS
March 31, December 31, March 31,
(Dollars in thousands) 2011 2010 2010
------------ ------------ ------------
(Unaudited) (Unaudited)
ASSETS
Cash and due from banks $ 41,715 $ 22,719 $ 19,359
Federal funds sold 12,000 12,000 36,000
------------ ------------ ------------
Cash and cash equivalents 53,715 34,719 55,359
Interest-bearing deposits in
other financial institutions 734 713 700
Securities available for sale 37,543 33,860 36,841
Federal Home Loan Bank stock 3,423 3,423 3,794
Loans:
Commercial 287,760 297,047 296,271
Mortgage 81,404 80,756 76,996
Installment 5,445 5,283 4,044
------------ ------------ ------------
Total Loans 374,609 383,086 377,311
Allowance for loan losses (6,184) (6,613) (4,737)
------------ ------------ ------------
Net loans 368,425 376,473 372,574
Premises and equipment 9,715 9,660 10,060
Other real estate held for sale 5,081 5,562 7,723
Other assets 14,154 14,286 15,376
------------ ------------ ------------
TOTAL ASSETS $ 492,790 $ 478,696 $ 502,427
============ ============ ============
LIABILITIES AND SHAREHOLDERS'
EQUITY
LIABILITIES:
Deposits:
Noninterest bearing
deposits $ 39,269 $ 41,264 $ 30,356
NOW, money market, checking 154,420 134,703 109,374
Savings 17,691 17,670 20,675
CDs < $100,000 104,258 96,977 75,822
CDs > $100,000 21,803 22,698 30,173
Brokered 63,342 73,467 138,812
------------ ------------ ------------
Total deposits 400,783 386,779 405,212
Borrowings:
Federal Home Loan Bank 35,000 35,000 35,000
Other 1,069 1,069 1,140
------------ ------------ ------------
Total borrowings 36,069 36,069 36,140
Other liabilities 1,841 1,966 2,353
------------ ------------ ------------
Total liabilities 438,693 424,814 443,705
Shareholders' equity:
Preferred stock - No par value:
Authorized 500,000 shares,
11,000 shares issued and
outstanding 10,757 10,706 10,562
Common stock and additional
paid in capital - No par value
Authorized - 18,000,000 shares
Issued and outstanding -
3,419,736 shares 43,525 43,525 43,502
Accumulated earnings (deficit) (705) (961) 3,724
Accumulated other
comprehensive income 520 612 934
------------ ------------ ------------
Total shareholders' equity 54,097 53,882 58,722
------------ ------------ ------------
TOTAL LIABILITIES AND
SHAREHOLDERS' EQUITY $ 492,790 $ 478,696 $ 502,427
============ ============ ============
MACKINAC FINANCIAL CORPORATION AND SUBSIDIARIES
CONSOLIDATED STATEMENTS OF OPERATIONS
Three Months Ended
March 31,
----------------------
(Dollars in thousands except per share data) 2011 2010
----------- ----------
(Unaudited) (Unaudited)
INTEREST INCOME:
Interest and fees on loans:
Taxable $ 5,136 $ 5,191
Tax-exempt 42 52
Interest on securities:
Taxable 282 397
Tax-exempt 7 7
Other interest income 33 40
----------- ----------
Total interest income 5,500 5,687
----------- ----------
INTEREST EXPENSE:
Deposits 1,219 1,457
Borrowings 140 208
----------- ----------
Total interest expense 1,359 1,665
----------- ----------
Net interest income 4,141 4,022
Provision for loan losses - 900
----------- ----------
Net interest income after provision for loan losses 4,141 3,122
----------- ----------
OTHER INCOME:
Service fees 217 223
Net security gains - 215
Income from loans sold 314 316
Other 46 53
----------- ----------
Total other income 577 807
----------- ----------
OTHER EXPENSE:
Salaries and employee benefits 1,824 1,720
Occupancy 365 345
Furniture and equipment 194 194
Data processing 176 189
Professional service fees 153 173
Loan and deposit 179 268
ORE writedowns and (gains) losses on sale 467 147
FDIC insurance assessment 285 222
Telephone 51 47
Advertising 88 72
Other 277 252
----------- ----------
Total other expense 4,059 3,629
----------- ----------
Income before provision for income taxes 659 300
Provision for (benefit of) income taxes 214 (3,411)
----------- ----------
NET INCOME $ 445 $ 3,711
----------- ----------
Preferred dividend and accretion of discount 189 185
----------- ----------
NET INCOME AVAILABLE TO COMMON SHAREHOLDERS $ 256 $ 3,526
=========== ==========
INCOME PER COMMON SHARE:
Basic $ .07 $ 1.03
=========== ==========
Diluted $ .07 $ 1.03
=========== ==========
MACKINAC FINANCIAL CORPORATION AND SUBSIDIARIES
LOAN PORTFOLIO AND CREDIT QUALITY
(Dollars in thousands)
Loan Portfolio Balances (at end of period):
March 31, December 31, March 31,
2011 2010 2010
------------ ------------ ------------
Commercial Loans
Real estate - operators of
nonresidential buildings $ 58,132 $ 58,114 $ 49,753
Hospitality and tourism 35,016 37,737 44,820
Operators of nonresidential
buildings 17,091 16,598 13,170
Real estate - operators of
nonresidential buildings 15,518 15,857 21,529
Other 138,565 135,411 138,964
------------ ------------ ------------
Total Commercial Loans 264,322 263,717 268,236
1-4 family residential real estate 75,663 75,074 70,087
Consumer 5,445 5,283 4,044
Construction
Commercial 23,438 33,330 28,035
Consumer 5,741 5,682 6,909
------------ ------------ ------------
Total Loans $ 374,609 $ 383,086 $ 377,311
============ ============ ============
Credit Quality (at end of period):
March 31, December 31, March 31,
2011 2010 2010
----------- ----------- -----------
Nonperforming Assets :
Nonaccrual loans $ 9,859 $ 5,921 $ 9,027
Loans past due 90 days or more - - -
Restructured loans 105 4,642 869
----------- ----------- -----------
Total nonperforming loans 9,964 10,563 9,896
Other real estate owned 5,081 5,562 7,723
----------- ----------- -----------
Total nonperforming assets $ 15,045 $ 16,125 $ 17,619
=========== =========== ===========
Nonperforming loans as a % of loans 2.66% 2.76% 2.62%
----------- ----------- -----------
Nonperforming assets as a % of
assets 3.05% 3.37% 3.51%
----------- ----------- -----------
Reserve for Loan Losses:
At period end $ 6,184 $ 6,613 $ 4,737
----------- ----------- -----------
As a % of loans 1.65% 1.73% 1.26%
----------- ----------- -----------
As a % of nonperforming loans 62.06% 62.61% 47.87%
----------- ----------- -----------
As a % of nonaccrual loans 62.72% 111.69% 52.48%
----------- ----------- -----------
Texas ratio 24.96% 26.66% 27.75%
=========== =========== ===========
Charge-off Information (year to
date):
Average loans $ 380,066 $ 384,347 $ 384,640
----------- ----------- -----------
Net charge-offs 429 5,112 1,389
----------- ----------- -----------
Charge-offs as a % of average
loans .11% 1.33% .36%
----------- ----------- -----------
MACKINAC FINANCIAL CORPORATION AND SUBSIDIARIES
QUARTERLY FINANCIAL HIGHLIGHTS
QUARTER ENDED
----------------------------------------------------------
(Unaudited)
----------------------------------------------------------
December September
March 31, 31, 30, June 30, March 31,
2011 2010 2010 2010 2010
---------- --------- --------- --------- ----------
BALANCE SHEET
(Dollars in
thousands)
Total loans $ 374,609 $ 383,086 $ 382,727 $ 384,839 $ 377,311
Allowance for
loan losses (6,184) (6,613) (5,437) (6,371) (4,737)
---------- --------- --------- --------- ----------
Total loans,
net 368,425 376,473 377,290 378,468 372,574
Intangible
assets - - - - -
Total assets 492,790 478,696 499,006 500,774 502,427
Core deposits 315,638 290,614 287,055 271,026 236,227
Noncore
deposits (1) 85,145 96,165 117,469 134,758 168,985
---------- --------- --------- --------- ----------
Total deposits 400,783 386,779 404,524 405,784 405,212
Total
borrowings 36,069 36,069 36,069 36,140 36,140
Common
shareholders'
equity 43,340 43,176 45,329 45,621 48,160
Total
shareholders'
equity 54,097 53,882 55,987 56,231 58,722
Total shares
outstanding 3,419,736 3,419,736 3,419,736 3,419,736 3,419,736
AVERAGE
BALANCES
(Dollars in
thousands)
Assets $ 478,861 $ 488,320 $ 512,335 $ 502,942 $ 508,495
Loans 380,066 385,296 385,268 382,169 384,640
Deposits 386,743 393,266 416,847 405,449 413,897
Common equity 43,147 44,339 46,041 47,542 44,577
Equity 53,870 55,015 56,668 57,889 55,109
INCOME
STATEMENT
(Dollars in
thousands)
Net interest
income $ 4,141 $ 4,276 $ 4,064 $ 4,023 $ 4,022
Provision for
loan losses - 1,800 1,000 2,800 900
---------- --------- --------- --------- ----------
Net interest
income after
provision 4,141 2,476 3,064 1,223 3,122
Total other
income 577 747 648 593 807
Total other
expense 4,059 4,037 3,601 5,330 3,629
---------- --------- --------- --------- ----------
Income before
taxes 659 (814) 111 (3,514) 300
Provision for
(benefit of)
income taxes 214 1,093 30 (1,212) (3,411)
---------- --------- --------- --------- ----------
Net income 445 (1,907) 81 (2,302) 3,711
---------- --------- --------- --------- ----------
Preferred
dividend
expense 189 185 185 186 185
---------- --------- --------- --------- ----------
Net income
(loss)
available to
common
shareholders $ 256 $ (2,092) $ (104) $ (2,488) $ 3,526
========== ========= ========= ========= ==========
PER SHARE DATA
Earnings $ .07 $ (.61) $ (.03) $ (.73) $ 1.03
Book value per
common share 12.67 12.63 13.26 13.34 14.08
Market value,
closing price 6.02 4.58 5.10 6.50 4.72
ASSET QUALITY
RATIOS
Nonperforming
loans/total
loans 2.66% 2.76 % 2.94 % 2.87 % 2.62%
Nonperforming
assets/total
assets 3.05 3.37 3.41 3.34 3.51
Allowance for
loan losses/
total loans 1.65 1.73 1.42 1.66 1.26
Allowance for
loan losses/
nonperforming
loans 62.06 62.61 48.34 57.69 47.87
Texas ratio (2) 24.96 26.66 27.68 26.71 27.76
PROFITABILITY
RATIOS
Return on
average assets .22% (1.70)% (.08)% (1.98)% 2.81%
Return on
average common
equity 2.40 (18.72) (.90) (20.99) 32.08
Return on
average equity 1.92 (15.09) (.73) (17.24) 25.95
Net interest
margin 3.92 3.88 3.69 3.56 3.51
Efficiency
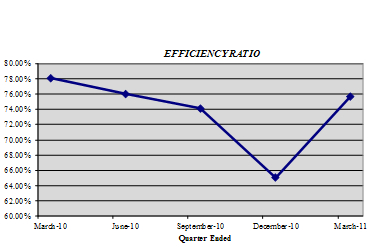
ratio 75.73 65.05 75.98 76.04 78.12
Average
loans/average
deposits 98.27 97.97 92.42 94.26 92.93
CAPITAL
ADEQUACY
RATIOS
Tier 1 leverage
ratio 9.70% 9.25 % 9.22 % 9.38 % 9.85%
Tier 1 capital
to risk
weighted
assets 11.61 11.36 11.73 11.65 12.48
Total capital
to risk
weighted
assets 12.86 12.62 12.98 12.91 13.69
Average
equity/average
assets 11.25 11.27 11.06 11.51 10.84
Tangible
equity/tangible
assets 11.25 11.27 11.06 11.51 10.84
(1) Noncore deposits includes Internet CDs, brokered deposits and CDs
greater than $100,000
(2) Texas ratio equals nonperforming assets divided by shareholders'
equity plus allowance for loan losses
Contact Information: Contact: Investor Relations (888) 343-8147 www.bankmbank.com