NORFOLK, NE--(Marketwire - Aug 10, 2011) - Supertel Hospitality, Inc. (
Revenues from continuing operations for the 2011 second quarter decreased 0.9 percent to $22.7 million, compared to the same year-ago period. Net loss attributable to common shareholders was $(4.5) million, or $(0.20) per diluted share, for the 2011 second quarter, compared to net loss attributable to common shareholders of $(4.0) million, or $(0.18) per diluted share, in the 2010 same quarter. The 2011 second quarter loss includes a total impairment charge of $4.8 million, comprised of a $2.8 million charge against one held for use property and a net impairment charge of $2.0 million taken collectively against 12 held for sale properties. Of this, $0.8 million was taken on nine of the hotels due to market changes, and $1.3 million was taken on the other three hotels due to changes in holding periods. There was also a recovery of previously recorded impairment on one sold property and one held for sale hotel in the amount of $0.1 million.
Funds from operations ("FFO") in the 2011 second quarter was a loss of $(2.2) million, or $(0.10) per diluted share, compared to a loss of $(1.5) million, or $(0.07) per diluted share, in the same 2010 period. Funds from operations without impairment, a non-cash item ("FFO without impairment") in the 2011 second quarter was $2.6 million, or $0.11 per diluted share, compared with $3.1 million or $0.14 per diluted share in the same period of 2010.
Earnings before interest, taxes, depreciation and amortization, noncontrolling interest and preferred stock dividends (Adjusted EBITDA) decreased to $1.3 million, compared to $2.4 million for the second quarter of 2010.
Second Quarter Highlights
- Transitioned 93 properties, representing 90 percent of the portfolio, to regional management companies:
- Hospitality Management Advisors, Inc., 25 hotels
- Strand Development Company, LLC, 23 hotels
- Kinseth Hotel Corporation, 45 hotels
- Sold two properties for gross proceeds of approximately $3.25 million.
- Reduced total debt by $4.8 million during the quarter.
- Refinanced the Sleep Inn in Omaha, Nebraska on a five-year note for $3.1 million at a rate of 6.25 percent.
"Consistent with the first quarter, the process of transitioning to three new management companies negatively impacted our second quarter results," said Kelly A. Walters, Supertel president and CEO. "As the former management company went through the process of shutting down their operations, several key managerial and sales positions were lost to attrition and planned reductions that clearly muted our participation in the hotel industry's recovery. As a consequence, the successor management companies will have to rebuild and reestablish the momentum that we were experiencing in 2010. Despite the expected setback, this transition was a critically important step in reshaping the company."
"In terms of the financial impact, we knew this move would be costly, but it was unavoidable as the change was absolutely necessary. The reassignment of properties generated a myriad of one-time charges and fees, which should be recovered over time with increased operating performance. The positive news is that our POI margins increased over last month on certain key assets, and we saw the equivalent of a 40 basis point reduction in our management fees."
Second Quarter Results
The company reported a net loss of $(4.1) million for the 2011 second quarter, compared to a net loss of $(3.7) million for the same 2010 period. All income and expenses related to sold and held for sale hotels are classified as discontinued operations.
After noncontrolling interest and recognition of dividends for preferred stock shareholders, the net loss attributable to common shareholders was $(4.5) million, or $(0.20) per diluted share, for the 2011 second quarter, compared with net loss attributable to common shareholders of $(4.0) million, or $(0.18) per diluted share, for the like 2010 period.
Second quarter 2011 revenues from continuing operations decreased $0.2 million, or 0.9 percent. This was primarily due to decreased occupancy in the second quarter, largely offset by a higher average daily rate ("ADR").
The portfolio of 85 hotels in continuing operations in the 2011 second quarter, compared with the same period a year earlier, reported a decrease of 4.2 percent in occupancy, with a 3.7 percent increase in ADR.
| Second Quarter 2011 vs Second Quarter 2010 | ||||||||||||||||||
| Occupancy (%) | ADR ($) | RevPar ($) | ||||||||||||||||
| 2011 | 2010 | Variance | 2011 | 2010 | Variance | 2011 | 2010 | Variance | ||||||||||
| Industry - Total US Market | 63.4 | 60.7 | 4.4% | 101.44 | 98.02 | 3.5% | 64.28 | 59.46 | 8.1% | |||||||||
| Supertel - Continuing Operations Portfolio | 66.3 | 69.2 | -4.2% | 51.06 | 49.22 | 3.7% | 33.83 | 34.07 | -0.7% | |||||||||
| Chain Scale | ||||||||||||||||||
| Industry - Midscale | 57.0 | 55.0 | 3.6% | 73.44 | 74.15 | -1.0% | 41.86 | 40.78 | 2.6% | |||||||||
| Supertel - Midscale | 64.0 | 68.7 | -6.8% | 69.21 | 65.85 | 5.1% | 44.27 | 45.22 | -2.1% | |||||||||
| Industry - Economy | 56.5 | 54.2 | 4.2% | 50.50 | 49.67 | 1.7% | 28.52 | 26.92 | 5.9% | |||||||||
| Supertel - Economy | 65.6 | 67.9 | -3.4% | 49.88 | 47.93 | 4.1% | 32.72 | 32.53 | 0.6% | |||||||||
| Industry - Extended Stay | N/A | N/A | N/A | N/A | N/A | N/A | N/A | N/A | N/A | |||||||||
| Supertel - Extended Stay | 73.1 | 75.1 | -2.7% | 23.75 | 23.67 | 0.3% | 17.37 | 17.78 | -2.3% | |||||||||
| Industry Source: STR Monthly Review | ||||||||||||||||||
Midscale Hotels
Second quarter RevPAR for the company's 28 continuing operations midscale hotels decreased 2.1 percent to $44.27. Occupancy for these properties declined 6.8 percent with a partially offsetting ADR increase of 5.1 percent to $69.21.
Economy Hotels
The company's 50 continuing operations economy hotels reported a 0.6 percent increase in RevPAR to $32.72 in the 2011 second quarter, caused by a 4.1 percent increase in ADR and offset by a 3.4 percent decline in occupancy.
Extended Stay Hotels
The company's seven continuing operations extended stay hotels reported a 2.3 percent decrease in RevPAR to $17.37, reflecting a 2.7 percent drop in occupancy to 73.1 percent, and a 0.3 percent increase in ADR to $23.75.
"During the 2005 to early 2008 timeframe, Supertel, in a manner consistent with our industry peers, acquired a substantial number of hotels at prices that, by today's market standards, would be difficult to justify," Walters said. "Over that three-year timeframe, Supertel acquired 56 hotels representing a total investment in excess of $210 million at capitalization rates that were unsustainable without a continuation of the over-exuberant economic climate. Since 2008, market conditions for hotels have turned decidedly less favorable in terms of occupancy and rate, particularly for older, non-branded hotels, which comprise a significant portion of the properties purchased by Supertel since 2005.
"The values of these properties are based primarily on revenue and property operating income ("POI"). In the past few years, the industry and Supertel have experienced reductions in revenue and POI resulting in a consequential decrease in valuations. Supertel, recognizing that market fundamentals have changed, adopted a strategy to monetize underperforming hotels in the portfolio, take our losses, and over time seek to stabilize the balance sheet while redeploying our capital into newer, better positioned hotels in stronger markets, which are less susceptible to the economic cycle."
Connie Scarpello, the company's chief financial officer, noted that in the past three years, the company has recorded more than $37 million in impairment, 93 percent of which was on properties acquired during the 2005 to 2008 time frame. "We strongly believe those hotels will never recover their value and that our decision to sell was the proper and prudent action to protect the integrity of our balance sheet," she said. "As difficult as the decisions have been, we believe we are rebuilding a healthier company with appropriately valued, income-producing, long-term assets."
"The economic rebound that we expected to provide some lift in many of our markets during the quarter never fully materialized," Walters added. "The sluggish economy, exacerbated by high gas prices, continued to impact the transient business in our hotels. Occupancies at our properties slipped a bit for the quarter, but ADR rose slightly. The South continued to underperform, led by Louisiana and Arkansas, which were hurt by a reduction in oil field operations in the region. Nevertheless, at the end of the second quarter, Supertel's overall occupancy remained above the industry average by nearly three percentage points, according to Smith Travel Research. Our task is now to maintain that margin, while increasing our ADR to match the market, which should result in a RevPAR performance above our peers in the industry, and more revenue falling to the bottom line."
Hotel and property operations expenses from continuing operations for the 2011 second quarter remained flat at $16.5 million, compared with the like 2010 period.
Interest expense from continuing operations for the quarter decreased by $0.1 million to $2.3 million. Depreciation and amortization expense from continuing operations decreased by $0.2 million from the 2010 second quarter to $2.6 million.
For the 2011 second quarter, POI from continuing operations decreased $0.2 million, or 3.3 percent, compared to the year-ago period. POI is calculated as revenue from room rentals and other hotel services less hotel and property operations expenses. The decrease in POI over the last quarter is largely a function of the decline in sales revenue.
General and administration expense from continuing operations for the 2011 second quarter increased $0.2 million compared to the prior period. The major causes of the increase include onetime charges related to the transition to the regional management companies.
Balance Sheet
The company as of June 30, 2011 had total debt of $170.7 million. Outstanding debt on hotels in continuing operations totaled $142.3 million, and has an average term to maturity of 3.7 years and a weighted average annual interest rate of 6.1 percent. The Company currently has 18 properties on its held for sale list with $28.4 million of associated debt, which it believes will be fully retired upon the sale of those assets.
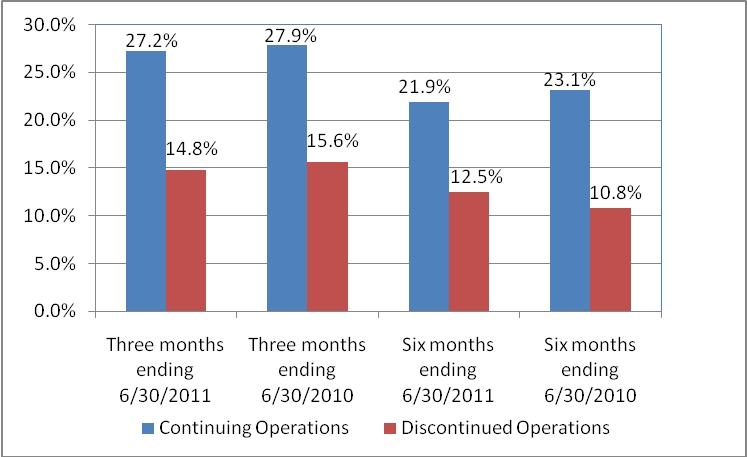
The company sold the 59-room Super 8 in Wichita, Kansas, as well as the 127-room Tara Inn in Jonesboro, Georgia for a total of approximately $3.25 million. Proceeds were used to pay down $2.5 million in direct debt with the remainder used to reduce the balance on the revolving line of credit. "The recent sales bring us a step closer to our ultimate goal of cycling out our underperforming assets," Scarpello noted. "The chart included (Property Operating Income (POI) as a Percent of Sales) shows the operating results of the continuing operations portfolio almost double the bottom line results of the held for sale assets."
Dividends
The company did not declare a common stock dividend for the 2011 second quarter. To date, preferred dividends have continued uninterrupted. The board of directors continues to monitor requirements to maintain the company's REIT status on a quarterly basis.
Outlook
"We have made a major strategic shift over the last two years at Supertel, and while the long term benefits are not showing up in the numbers yet, we are observing them on the ground," Walters said. "As a result, we are even more confident and optimistic about the company's long-term potential. We believe that it will take at least through the fourth quarter before we start seeing the positive impact of the new operators' influence on the portfolio, but we firmly believe that our transition to the new structure effectively places us on the path toward a solid recovery with a more aggressive growth trajectory."
"According to Smith Travel Research, the overall outlook for the entire hotel industry continues to be favorable, but the near term pace of recovery in many markets will likely be adversely affected by the growing concerns about the leadership in Washington. Still, in spite of the concerns of the country, our industry is clearly much healthier today than it has been in years, due in large part to the discipline now being practiced by hotel developers/owners and their financial institutions alike," Walters concluded.
About Supertel Hospitality, Inc.
As of June 30, 2011, Supertel Hospitality, Inc. (
Certain matters within this press release are discussed using forward-looking language as specified in the Private Securities Litigation Reform Act of 1995, and, as such, may involve known and unknown risks, uncertainties and other factors that may cause the actual results or performance to differ from those projected in the forward-looking statement. These risks are discussed in the Company's filings with the Securities and Exchange Commission.
SELECTED FINANCIAL DATA:
The following table sets forth the Company's balance sheet as of June 30, 2011 and December 31, 2010. The Company owned 103 hotels (including 18 hotels held for sale) at June 30, 2011 and 106 hotels (including 18 hotels held for sale) as of December 31, 2010 respectively.
(in thousands, except share and per share data)
| As of | ||||||||||
| June 30, | December 31, | |||||||||
| 2011 | 2010 | |||||||||
| (unaudited) | ||||||||||
| ASSETS | ||||||||||
| Investments in hotel properties | $ | 289,588 | $ | 291,157 | ||||||
| Less accumulated depreciation | 91,156 | 86,976 | ||||||||
| 198,432 | 204,181 | |||||||||
| Cash and cash equivalents | 550 | 333 | ||||||||
| Accounts receivable, net of allowance for doubtful accounts of $115 and $133 | 2,111 | 1,717 | ||||||||
| Prepaid expenses and other assets | 8,288 | 13,372 | ||||||||
| Deferred financing costs, net | 822 | 988 | ||||||||
| Investment in hotel properties, held for sale, net | 28,698 | 36,053 | ||||||||
| $ | 238,901 | $ | 256,644 | |||||||
| LIABILITIES AND EQUITY | ||||||||||
| LIABILITIES | ||||||||||
| Accounts payable, accrued expenses and other liabilities | $ | 12,861 | $ | 17,732 | ||||||
| Debt related to hotel properties held for sale | 28,358 | 32,255 | ||||||||
| Long-term debt | 142,297 | 142,755 | ||||||||
| 183,516 | 192,742 | |||||||||
| Redeemable noncontrolling interest in consolidated partnership, at redemption value | 511 | 511 | ||||||||
| Redeemable preferred stock 10% Series B, 800,000 shares authorized; $.01 par value, 332,500 shares outstanding, liquidation preference of $8,312 | 7,662 | 7,662 | ||||||||
| EQUITY | ||||||||||
| Shareholders' equity | ||||||||||
| Preferred stock, 40,000,000 shares authorized; 8% Series A, 2,500,000 shares authorized, $.01 par value, 803,270 shares outstanding, liquidation preference of $8,033 | 8 | 8 | ||||||||
| Common stock, $.01 par value, 100,000,000 shares authorized; 23,005,387 and 22,917,509 shares outstanding | 230 | 229 | ||||||||
| Common stock warrants | 252 | 252 | ||||||||
| Additional paid-in capital | 121,572 | 121,384 | ||||||||
| Distributions in excess of retained earnings | (75,025 | ) | (66,479 | ) | ||||||
| Total shareholders' equity | 47,037 | 55,394 | ||||||||
| Noncontrolling interest | ||||||||||
| Noncontrolling interest in consolidated partnership, redemption value $89 and $250 | 175 | 335 | ||||||||
| Total equity | 47,212 | 55,729 | ||||||||
| COMMITMENTS AND CONTINGENCIES | ||||||||||
| $ | 238,901 | $ | 256,644 | |||||||
The following table sets forth the Company's results of operations for the three and six months ended June 30, 2011 and 2010, respectively.
(Unaudited in thousands, except per share data)
| Three Months Ended | Six Months Ended | ||||||||||||||||
| June 30, | June 30, | ||||||||||||||||
| 2011 | 2010 | 2011 | 2010 | ||||||||||||||
| REVENUES | (unaudited) | (unaudited) | |||||||||||||||
| Room rentals and other hotel services | $ | 22,666 | $ | 22,867 | $ | 40,098 | $ | 39,962 | |||||||||
| EXPENSES | |||||||||||||||||
| Hotel and property operations | 16,493 | 16,484 | 31,328 | 30,721 | |||||||||||||
| Depreciation and amortization | 2,570 | 2,755 | 5,081 | 5,523 | |||||||||||||
| General and administrative | 1,001 | 800 | 2,105 | 1,799 | |||||||||||||
| Termination cost | - | - | 540 | - | |||||||||||||
| 20,064 | 20,039 | 39,054 | 38,043 | ||||||||||||||
| EARNINGS BEFORE NET LOSS ON DISPOSITIONS OF ASSETS, OTHER INCOME, INTEREST EXPENSE AND INCOME TAXES | 2,602 | 2,828 | 1,044 | 1,919 | |||||||||||||
| Net loss on dispositions of assets | (8 | ) | (23 | ) | (14 | ) | (39 | ) | |||||||||
| Other income | 20 | 35 | 105 | 61 | |||||||||||||
| Interest expense | (2,348 | ) | (2,400 | ) | (4,884 | ) | (4,789 | ) | |||||||||
| Impairment | (2,801 | ) | (2,147 | ) | (2,801 | ) | (2,147 | ) | |||||||||
| LOSS FROM CONTINUING OPERATIONS BEFORE INCOME TAXES | (2,535 | ) | (1,707 | ) | (6,550 | ) | (4,995 | ) | |||||||||
| Income tax (expense) benefit | (61 | ) | (116 | ) | 800 | 585 | |||||||||||
| LOSS FROM CONTINUING OPERATIONS | (2,596 | ) | (1,823 | ) | (5,750 | ) | (4,410 | ) | |||||||||
| Loss from discontinued operations, net of tax | (1,516 | ) | (1,852 | ) | (2,073 | ) | (2,282 | ) | |||||||||
| NET LOSS | (4,112 | ) | (3,675 | ) | (7,823 | ) | (6,692 | ) | |||||||||
| Noncontrolling interest | 3 | 11 | 14 | 18 | |||||||||||||
| NET LOSS ATTRIBUTABLE TO CONTROLLING INTERESTS | (4,109 | ) | (3,664 | ) | (7,809 | ) | (6,674 | ) | |||||||||
| Preferred stock dividends | (369 | ) | (369 | ) | (737 | ) | (737 | ) | |||||||||
| NET LOSS ATTRIBUTABLE TO COMMON SHAREHOLDERS | $ | (4,478 | ) | $ | (4,033 | ) | $ | (8,546 | ) | $ | (7,411 | ) | |||||
| NET EARNINGS PER COMMON SHARE - BASIC AND DILUTED | |||||||||||||||||
| EPS from continuing operations | $ | (0.13 | ) | $ | (0.10 | ) | $ | (0.28 | ) | $ | (0.23 | ) | |||||
| EPS from discontinued operations | $ | (0.07 | ) | $ | (0.08 | ) | $ | (0.09 | ) | $ | (0.10 | ) | |||||
| EPS basic and diluted | $ | (0.20 | ) | $ | (0.18 | ) | $ | (0.37 | ) | $ | (0.33 | ) | |||||
RECONCILIATION OF NON-GAAP FINANCIAL MEASURES
Unaudited-In thousands, except per share data:
| Three months | Six Months | ||||||||||||||||
| ended June 30, | ended June 30, | ||||||||||||||||
| 2011 | 2010 | 2011 | 2010 | ||||||||||||||
| Weighted average shares outstanding for: | |||||||||||||||||
| calculation of FFO per share - basic | 22,964 | 22,412 | 22,941 | 22,209 | |||||||||||||
| calculation of FFO per share - diluted | 22,964 | 22,412 | 22,941 | 22,209 | |||||||||||||
| Reconciliation of net loss to FFO | |||||||||||||||||
| Net loss attributable to common shareholders | $ | (4,478 | ) | $ | (4,033 | ) | $ | (8,546 | ) | $ | (7,411 | ) | |||||
| Depreciation and amortization | 2,643 | 3,012 | 5,263 | 6,052 | |||||||||||||
| Net gain on disposition of assets | (354 | ) | (503 | ) | (335 | ) | (467 | ) | |||||||||
| FFO attributable to common shareholders | (2,189 | ) | (1,524 | ) | (3,618 | ) | (1,826 | ) | |||||||||
| Impairment | 4,813 | 4,596 | 5,262 | 4,716 | |||||||||||||
| FFO without impairment, a non-cash item | $ | 2,624 | $ | 3,072 | $ | 1,644 | $ | 2,890 | |||||||||
| FFO per share - basic | $ | (0.10 | ) | $ | (0.07 | ) | $ | (0.16 | ) | $ | (0.08 | ) | |||||
| FFO without impairment, a non-cash item, per share - basic | $ | 0.11 | $ | 0.14 | $ | 0.07 | $ | 0.13 | |||||||||
| FFO per share - diluted | $ | (0.10 | ) | $ | (0.07 | ) | $ | (0.16 | ) | $ | (0.08 | ) | |||||
| FFO without impairment, a non-cash item, per share - diluted | $ | 0.11 | $ | 0.14 | $ | 0.07 | $ | 0.13 | |||||||||
FFO is a non-GAAP financial measure. We consider FFO to be a market accepted measure of an equity REIT's operating performance, which is necessary, along with net earnings (loss), for an understanding of our operating results. FFO, as defined under the National Association of Real Estate Investment Trusts (NAREIT) standards, consists of net income computed in accordance with GAAP, excluding gains (or losses) from sales of real estate assets, plus depreciation and amortization of real estate assets. We believe our method of calculating FFO complies with the NAREIT definition. FFO does not represent amounts available for management's discretionary use because of needed capital replacement or expansion, debt service obligations, or other commitments and uncertainties. FFO should not be considered as an alternative to net income (loss) (computed in accordance with GAAP) as an indicator of our liquidity, nor is it indicative of funds available to fund our cash needs, including our ability to pay dividends or make distributions. All REITs do not calculate FFO in the same manner; therefore, our calculation may not be the same as the calculation of FFO for similar REITs.
We use FFO as a performance measure to facilitate a periodic evaluation of our operating results relative to those of our peers, who, like us, are typically members of NAREIT. We consider FFO a useful additional measure of performance for an equity REIT because it facilitates an understanding of the operating performance of our properties without giving effect to real estate depreciation and amortization, which assume that the value of real estate assets diminishes predictably over time. Since real estate values have historically risen or fallen with market conditions, we believe that FFO provides a meaningful indication of our performance.
FFO without impairment, a non-cash item, ("FFO without impairment") is a non-GAAP financial measure. As a result of a significant downturn in hotel and lodging fundamentals that took place in 2008 and 2009 and the related decrease in hotel and real estate valuations, we decided that FFO available to common shareholders did not provide all of the information that allows us to better evaluate our operating performance.
To arrive at FFO without impairment, we adjust FFO available to common shareholders, to exclude the following items:
(i) impairment charges of hotel properties that we have sold or expect to sell, included in discontinued operations; and
(ii) impairment charges of hotel properties classified as held for use.
We believe that these items are driven by factors relating to the fundamental disruption in the global financial and real estate markets, rather than factors specific to the company or the performance of our properties or investments.
The impairment charges of hotel properties that were recognized in 2009 and 2010 were primarily based on valuations of hotels, which had declined due to market conditions that we no longer expected to hold for long-term investment, and/or for which we have reduced our prior expected holding periods. In order to enhance liquidity, we have declared certain properties as held for sale and may declare other properties held for sale. To the extent these properties are expected to be sold at a loss, we record an impairment charge when the loss is known. We have recognized certain of these impairment charges in several quarters in 2009 and 2010 and in the first two quarters of 2011, and we believe it is reasonably likely that we will recognize similar charges and recovery in the near future.
However, we believe that as the financial markets stabilize, the potential for impairment charges of our hotel properties will diminish. We believe FFO without impairment provides investors with an additional measure to evaluate our operating performance as we emerge from this period of fundamental disruption in the global financial and real estate markets.
We analyze our operating performance primarily by revenues from our hotel properties, net of operating, administrative and financing expenses which are not directly impacted by short term fluctuations in the market value of our hotel properties. As a result, although these non-cash impairment charges have had a material impact on our financial results and are reflected in our financial statements, the removal of the effects of these items allows us to better understand the core operating performance of our properties.
| Unaudited-In thousands, except statistical data: | Three months | Six months | |||||||||||||||
| ended June 30, | ended June 30, | ||||||||||||||||
| 2011 | 2010 | 2011 | 2010 | ||||||||||||||
| RECONCILIATION OF NET LOSS TO ADJUSTED EBITDA | |||||||||||||||||
| Net loss attributable to common shareholders | $ | (4,478 | ) | $ | (4,033 | ) | $ | (8,546 | ) | $ | (7,411 | ) | |||||
| Interest expense, including discontinued operations | 2,862 | 3,075 | 5,964 | 6,130 | |||||||||||||
| Income tax benefit, including discontinued operations | (55 | ) | (62 | ) | (1,127 | ) | (1,168 | ) | |||||||||
| Depreciation and amortization, including discontinued operations | 2,643 | 3,012 | 5,263 | 6,052 | |||||||||||||
| EBITDA | 972 | 1,992 | 1,554 | 3,603 | |||||||||||||
| Noncontrolling interest | (3 | ) | (11 | ) | (14 | ) | (18 | ) | |||||||||
| Preferred stock dividend | 369 | 369 | 737 | 737 | |||||||||||||
| ADJUSTED EBITDA | $ | 1,338 | $ | 2,350 | $ | 2,277 | $ | 4,322 | |||||||||
Adjusted EBITDA is a financial measure that is not calculated in accordance with accounting principles generally accepted in the United States of America ("GAAP"). We calculate Adjusted EBITDA by adding back to net earnings (loss) available to common shareholders certain non-operating expenses and non-cash charges which are based on historical cost accounting and we believe may be of limited significance in evaluating current performance. We believe these adjustments can help eliminate the accounting effects of depreciation and amortization and financing decisions and facilitate comparisons of core operating profitability between periods, even though Adjusted EBITDA also does not represent an amount that accrues directly to common shareholders. In calculating Adjusted EBITDA, we also add back preferred stock dividends and noncontrolling interests, which are cash charges.
Adjusted EBITDA doesn't represent cash generated from operating activities determined by GAAP and should not be considered as an alternative to net income, cash flow from operations or any other operating performance measure prescribed by GAAP. Adjusted EBITDA is not a measure of our liquidity, nor is Adjusted EBITDA indicative of funds available to fund our cash needs, including our ability to make cash distributions. Neither does the measurement reflect cash expenditures for long-term assets and other items that have been and will be incurred. Adjusted EBITDA may include funds that may not be available for management's discretionary use due to functional requirements to conserve funds for capital expenditures, property acquisitions, and other commitments and uncertainties. To compensate for this, management considers the impact of these excluded items to the extent they are material to operating decisions or the evaluation of our operating performance. Adjusted EBITDA, as presented, may not be comparable to similarly titled measures of other companies.
The following table sets forth the operations of the Company's same store hotel properties for the three and six months ended June 30, 2011 and 2010, respectively.
| Unaudited-In thousands, except statistical data: | Three months | Six months | |||||||||||||||||
| ended June 30, | ended June 30, | ||||||||||||||||||
| 2011 | 2010 | 2011 | 2010 | ||||||||||||||||
| Same Store: | |||||||||||||||||||
| Revenue per available room (RevPAR): | |||||||||||||||||||
| Midscale | $ | 44.27 | $ | 45.22 | $ | 38.52 | $ | 38.90 | |||||||||||
| Economy | $ | 32.72 | $ | 32.53 | $ | 28.79 | $ | 28.40 | |||||||||||
| Extended Stay | $ | 17.37 | $ | 17.78 | $ | 17.69 | $ | 17.49 | |||||||||||
| Total | $ | 33.83 | $ | 34.07 | $ | 30.01 | $ | 29.88 | |||||||||||
| Average daily room rate (ADR): | |||||||||||||||||||
| Midscale | $ | 69.21 | $ | 65.85 | $ | 66.54 | $ | 64.17 | |||||||||||
| Economy | $ | 49.88 | $ | 47.93 | $ | 48.51 | $ | 46.97 | |||||||||||
| Extended Stay | $ | 23.75 | $ | 23.67 | $ | 23.61 | $ | 23.41 | |||||||||||
| Total | $ | 51.06 | $ | 49.22 | $ | 48.95 | $ | 47.65 | |||||||||||
| Occupancy percentage: | |||||||||||||||||||
| Midscale | 64.0 | % | 68.7 | % | 57.9 | % | 60.6 | % | |||||||||||
| Economy | 65.6 | % | 67.9 | % | 59.3 | % | 60.5 | % | |||||||||||
| Extended Stay | 73.1 | % | 75.1 | % | 74.9 | % | 74.7 | % | |||||||||||
| Total | 66.3 | % | 69.2 | % | 61.3 | % | 62.7 | % | |||||||||||
This presentation includes non-GAAP financial measures. The Company believes that the presentation of hotel property operating income (POI) is helpful to investors, and represents a more useful description of its operations, as it better communicates the comparability of its hotels' operating results.
Same Store reflects 85 hotels in continuing operations for the three months and year to date ended June 30, 2011 and 2010.
| Unaudited-In thousands, except statistical data: | Three months | Six months | ||||||||||||||||
| ended June 30, | ended June 30, | |||||||||||||||||
| 2011 | 2010 | 2011 | 2010 | |||||||||||||||
| Total Hotels: | ||||||||||||||||||
| Revenue per available room (RevPAR): | $ | 33.83 | $ | 34.07 | $ | 30.01 | $ | 29.88 | ||||||||||
| Average daily room rate (ADR): | $ | 51.06 | $ | 49.22 | $ | 48.95 | $ | 47.65 | ||||||||||
| Occupancy percentage: | 66.3 | % | 69.2 | % | 61.3 | % | 62.7 | % | ||||||||||
| Revenue from room rentals and other hotel services consists of: | ||||||||||||||||||
| Room rental revenue | $ | 22,046 | $ | 22,197 | $ | 38,888 | $ | 38,715 | ||||||||||
| Telephone revenue | 75 | 75 | 146 | 154 | ||||||||||||||
| Other hotel service revenues | 545 | 595 | 1,064 | 1,093 | ||||||||||||||
| Total revenue from room rentals and other hotel services | $ | 22,666 | $ | 22,867 | $ | 40,098 | $ | 39,962 | ||||||||||
| Hotel and property operations expense | ||||||||||||||||||
| Total hotel and property operations expense | $ | 16,493 | $ | 16,484 | $ | 31,328 | $ | 30,721 | ||||||||||
| Property Operating Income ("POI") | ||||||||||||||||||
| Total property operating income | $ | 6,173 | $ | 6,383 | $ | 8,770 | $ | 9,241 | ||||||||||
| POI as a percentage of revenue from room rentals and other hotel services | ||||||||||||||||||
| Total POI as a percentage of revenue | 27.2 | % | 27.9 | % | 21.9 | % | 23.1 | % | ||||||||||
| Same Store reflects 85 hotels. | ||||||||||||||||||
| Discontinued Operations | ||||||||||||||||||
| Room rentals and other hotel services | ||||||||||||||||||
| Total room rental and other hotel services | $ | 4,081 | $ | 5,453 | $ | 8,224 | $ | 10,081 | ||||||||||
| Hotel and property operations expense | ||||||||||||||||||
| Total hotel and property operations expense | $ | 3,476 | $ | 4,605 | $ | 7,200 | $ | 8,990 | ||||||||||
| Property Operating Income ("POI") | ||||||||||||||||||
| Total property operating income | $ | 605 | $ | 848 | $ | 1,024 | $ | 1,091 | ||||||||||
| POI as a percentage of revenue from room rentals and other hotel services | ||||||||||||||||||
| Total POI as a percentage of revenue | 14.8 | % | 15.6 | % | 12.5 | % | 10.8 | % | ||||||||||
| RECONCILIATION OF NET LOSS FROM CONTINUING OPERATIONS TO POI | ||||||||||||||||||
| Net loss | $ | (2,596 | ) | $ | (1,823 | ) | $ | (5,750 | ) | $ | (4,410 | ) | ||||||
| Depreciation and amortization | 2,570 | 2,755 | 5,081 | 5,523 | ||||||||||||||
| Net loss on disposition of assets | 8 | 23 | 14 | 39 | ||||||||||||||
| Other income | (20 | ) | (35 | ) | (105 | ) | (61 | ) | ||||||||||
| Interest expense | 2,348 | 2,400 | 4,884 | 4,789 | ||||||||||||||
| General and administrative expense | 1,001 | 800 | 2,105 | 1,799 | ||||||||||||||
| Termination cost | - | - | 540 | - | ||||||||||||||
| Income tax benefit | 61 | 116 | (800 | ) | (585 | ) | ||||||||||||
| Impairment | 2,801 | 2,147 | 2,801 | 2,147 | ||||||||||||||
| POI | $ | 6,173 | $ | 6,383 | $ | 8,770 | $ | 9,241 | ||||||||||
| Net loss as a percentage of continuing operations revenue from room rentals and other hotel services | -11.5 | % | -8.0 | % | -14.3 | % | -11.0 | % | ||||||||||
The following unaudited table presents our RevPAR, ADR and Occupancy, by region, for the three months ended June 30, 2011 and 2010, respectively. The comparisons of same store operations are for 85 hotels in continuing operations as of April 1, 2010.
| Three months ended June 30, 2011 |
Three months ended June 30, 2010 |
|||||||||||||||||||||
| Same Store | Room | Room | ||||||||||||||||||||
| Region | Count | RevPAR | Occupancy | ADR | Count | RevPAR | Occupancy | ADR | ||||||||||||||
| Mountain | 214 | $ | 35.03 | 69.2 | % | $ | 50.60 | 214 | $ | 35.79 | 72.7 | % | $ | 49.26 | ||||||||
| West North Central | 2,409 | 31.81 | 64.2 | % | 49.59 | 2,409 | 30.58 | 64.2 | % | 47.62 | ||||||||||||
| East North Central | 1,081 | 36.70 | 59.8 | % | 61.42 | 1,081 | 39.07 | 65.9 | % | 59.32 | ||||||||||||
| Middle Atlantic | 142 | 47.62 | 79.9 | % | 59.63 | 142 | 46.44 | 81.3 | % | 57.12 | ||||||||||||
| South Atlantic | 2,233 | 33.14 | 72.4 | % | 45.76 | 2,233 | 32.56 | 73.6 | % | 44.25 | ||||||||||||
| East South Central | 708 | 37.23 | 58.6 | % | 63.51 | 708 | 39.98 | 68.1 | % | 58.74 | ||||||||||||
| West South Central | 373 | 30.26 | 69.4 | % | 43.57 | 373 | 34.29 | 80.9 | % | 42.41 | ||||||||||||
| Total Hotels | 7,160 | $ | 33.83 | 66.3 | % | $ | 51.06 | 7,160 | $ | 34.07 | 69.2 | % | $ | 49.22 | ||||||||
| States included in the Regions | ||||||||||||||||||||||
| Mountain | Idaho and Montana | |||||||||||||||||||||
| West North Central | Iowa, Kansas, Missouri, Nebraska and South Dakota | |||||||||||||||||||||
| East North Central | Indiana and Wisconsin | |||||||||||||||||||||
| Middle Atlantic | Pennsylvania | |||||||||||||||||||||
| South Atlantic | Delaware, Florida, Georgia, Maryland, North Carolina, South Carolina, Virginia and West Virginia | |||||||||||||||||||||
| East South Central | Kentucky and Tennessee | |||||||||||||||||||||
| West South Central | Arkansas and Louisiana | |||||||||||||||||||||
The following unaudited table presents our RevPAR, ADR and Occupancy, by region, for the six months ended June 30, 2011 and 2010, respectively. The comparisons of same store operations are for 85 hotels in continuing operations as of January 1, 2010.
| Six months ended June 30, 2011 |
Six months ended June 30, 2010 |
|||||||||||||||||||||
| Same Store | Room | Room | ||||||||||||||||||||
| Region | Count | RevPAR | Occupancy | ADR | Count | RevPAR | Occupancy | ADR | ||||||||||||||
| Mountain | 214 | $ | 29.22 | 60.8 | % | $ | 48.06 | 214 | $ | 30.71 | 64.6 | % | $ | 47.54 | ||||||||
| West North Central | 2,409 | 27.61 | 57.6 | % | 47.96 | 2,409 | 26.82 | 57.4 | % | 46.70 | ||||||||||||
| East North Central | 1,081 | 32.12 | 53.8 | % | 59.69 | 1,081 | 33.58 | 57.6 | % | 58.32 | ||||||||||||
| Middle Atlantic | 142 | 39.62 | 69.9 | % | 56.71 | 142 | 37.10 | 64.2 | % | 57.81 | ||||||||||||
| South Atlantic | 2,233 | 30.21 | 70.1 | % | 43.08 | 2,233 | 28.65 | 68.6 | % | 41.78 | ||||||||||||
| East South Central | 708 | 32.94 | 52.7 | % | 62.49 | 708 | 34.83 | 59.7 | % | 58.35 | ||||||||||||
| West South Central | 373 | 29.36 | 67.5 | % | 43.47 | 373 | 33.61 | 80.6 | % | 41.72 | ||||||||||||
| Total Hotels | 7,160 | $ | 30.01 | 61.3 | % | $ | 48.95 | 7,160 | $ | 29.88 | 62.7 | % | $ | 47.65 | ||||||||
| States included in the Regions | ||||||||||||||||||||||
| Mountain | Idaho and Montana | |||||||||||||||||||||
| West North Central | Iowa, Kansas, Missouri, Nebraska and South Dakota | |||||||||||||||||||||
| East North Central | Indiana and Wisconsin | |||||||||||||||||||||
| Middle Atlantic | Pennsylvania | |||||||||||||||||||||
| South Atlantic | Delaware, Florida, Georgia, Maryland, North Carolina, South Carolina, Virginia and West Virginia | |||||||||||||||||||||
| East South Central | Kentucky and Tennessee | |||||||||||||||||||||
| West South Central | Arkansas and Louisiana | |||||||||||||||||||||
Contact Information:
Contact:
Ms. Krista Arkfeld
Director of Corporate Communications
karkfeld@supertelinc.com
Jerry Daly
Carol McCune
Daly Gray
(Media Contact)
703.435.6293
jerry@dalygray.com