Baltic Power, Hai Long and Oneida projects continue to make construction progress
TORONTO, Aug. 14, 2024 (GLOBE NEWSWIRE) -- Northland Power Inc. (“Northland” or the “Company”) (TSX: NPI) reported today financial results for the three and six months ended June 30, 2024. All dollar amounts set out herein are in thousands of Canadian dollars, unless otherwise stated.
“Northland’s strong performance in the second quarter has contributed to solid results for the first half of 2024, largely driven by high wind resource at our offshore wind facilities,” said John Brace, Northland’s Executive Chair. “We also continue to make progress on the construction of our two offshore wind projects in Taiwan and Poland, and our energy storage project in Canada. The execution of these three projects remains our top priority as we focus on their safe and successful delivery. At the same time, we remain active in pursuing various development opportunities in core markets across our 9GW development pipeline. We are also happy to report we completed the sale of our interest in the La Lucha Solar Facility in Mexico.”
Second Quarter Highlights
Financial results for the three months ended June 30, 2024, were higher compared to the same quarter of 2023, primarily due to higher wind resource across all offshore wind facilities, contribution from the New York onshore wind projects that achieved commercial operations in October 2023 and higher revenue from EBSA due to higher market demand, foreign exchange changes and rate escalations. This increase was partially offset by lower revenue generated from the Canadian solar facilities due to lower solar resource, and higher unpaid curtailments related to negative prices and grid outages at our German facilities.
Financial Results
- Sales increased to $529 million from $472 million in 2023.
- Gross Profit increased to $483 million from $427 million in 2023.
- Net Income increased to $262 million from $22 million in 2023.
- Adjusted EBITDA (a non-IFRS measure) increased to $268 million from $232 million in 2023.
- Adjusted Free Cash Flow per share (a non-IFRS measure) increased to $0.27 from $0.25 in 2023.
- Free Cash Flow per share (a non-IFRS measure) increased to $0.20 from $0.16 in 2023.
The following table presents key IFRS and non-IFRS financial measures and operational results. Sales, gross profit, operating income and net income, as reported under IFRS, include consolidated results of entities not wholly owned by Northland, whereas Northland’s non-IFRS financial measures include only Northland’s proportionate ownership interest.
| Summary of Consolidated Results | ||||||||||||
| (in thousands of dollars, except per share amounts) | Three months ended June 30, | Six months ended June 30, | ||||||||||
| 2024 | 2023 | 2024 | 2023 | |||||||||
| FINANCIALS | ||||||||||||
| Sales | $ | 528,974 | $ | 471,547 | $ | 1,283,894 | $ | 1,093,268 | ||||
| Gross profit | 483,376 | 427,468 | 1,180,830 | 996,371 | ||||||||
| Operating income | 152,025 | 102,625 | 498,194 | 375,167 | ||||||||
| Net income (loss) | 262,356 | 21,662 | 411,653 | 128,799 | ||||||||
| Net income (loss) attributable to shareholders | 246,090 | 4,341 | 321,693 | 74,235 | ||||||||
| Adjusted EBITDA (a non-IFRS measure) (2) | 268,190 | 232,255 | 722,056 | 583,954 | ||||||||
| Cash provided by operating activities | 170,998 | 204,278 | 473,414 | 501,340 | ||||||||
| Adjusted Free Cash Flow (a non-IFRS measure) (2) | 68,594 | 62,703 | 294,325 | 242,773 | ||||||||
| Free Cash Flow (a non-IFRS measure) (2) | 51,389 | 41,289 | 268,796 | 195,981 | ||||||||
| Cash dividends paid | 49,836 | 51,148 | 100,994 | 101,195 | ||||||||
| Total dividends declared (1) | $ | 77,061 | $ | 75,749 | $ | 153,760 | $ | 151,065 | ||||
| Per Share | ||||||||||||
| Weighted average number of shares — basic and diluted (000s) | 256,659 | 252,356 | 256,070 | 251,579 | ||||||||
| Net income (loss) attributable to common shareholders — basic and diluted | $ | 0.95 | $ | 0.01 | $ | 1.24 | $ | 0.28 | ||||
| Adjusted Free Cash Flow — basic (a non-IFRS measure) (2) | $ | 0.27 | $ | 0.25 | $ | 1.15 | $ | 0.96 | ||||
| Free Cash Flow — basic (a non-IFRS measure) (2) | $ | 0.20 | $ | 0.16 | $ | 1.05 | $ | 0.78 | ||||
| Total dividends declared | $ | 0.30 | $ | 0.30 | $ | 0.60 | $ | 0.60 | ||||
| ENERGY VOLUMES | ||||||||||||
| Electricity production in gigawatt hours (GWh) | 2,563 | 2,024 | 6,030 | 4,855 | ||||||||
| (1) Represents total dividends paid to common shareholders, including dividends in cash or in shares under Northland’s dividend reinvestment plan. | ||||||||||||
| (2) See Forward-Looking Statements and Non-IFRS Financial Measures below. | ||||||||||||
Second Quarter Results Summary
Offshore wind facilities
Electricity production for the three months ended June 30, 2024, increased by 14% or 111GWh compared to the same quarter of 2023. This was primarily due to a higher wind resource across all offshore wind facilities, partially offset by higher unpaid curtailments related to negative prices and grid outages at our German facilities.
Sales of $241 million for the three months ended June 30, 2024, increased 9% or $20 million, compared to the same quarter of 2023, primarily due to higher production across all offshore wind facilities by $28 million, partially offset by a $5 million P&I factor adjustment and $3 million related to various other items.
Adjusted EBITDA of $131 million for the three months ended June 30, 2024, increased 8% or $10 million compared to the same quarter of 2023, due to the same factors as noted above.
An important indicator for performance of offshore wind facilities is the current and historical average power production of the facility. The following tables summarize actual electricity production and the historical average, high and low, for the applicable operating periods of each offshore facility:
| Three months ended June 30, | 2024 (1) | 2023 (1) | Historical Average (2) | Historical High (2) | Historical Low (2) | ||||
| Electricity production (GWh) | |||||||||
| Gemini | 498 | 433 | 446 | 498 | 385 | ||||
| Nordsee One | 207 | 188 | 190 | 220 | 150 | ||||
| Deutsche Bucht | 188 | 160 | 165 | 188 | 141 | ||||
| Total | 893 | 781 | |||||||
| (1) Includes GWh produced and attributed to paid curtailments. | |||||||||
| (2) Represents the historical power production since the commencement of commercial operation of the respective facility (2017 for Gemini and Nordsee One and 2020 for Deutsche Bucht) and excludes unpaid curtailments. | |||||||||
In June 2024, one of Gemini’s two export cables was damaged and taken out of service. The subsea repair of the cable has commenced and completion is expected in the third quarter. Gemini’s production continued via the second export cable. This event occurred during the lower production season and is expected to have an immaterial impact, net of the anticipated insurance proceeds, to Northland’s full year results.
Onshore renewable facilities
Electricity production was 26% or 136GWh higher than the same quarter of 2023, primarily due to the contribution from the New York onshore wind projects that achieved commercial operations in October 2023, and higher wind and solar resource at the Spanish onshore renewable facilities, partially offset by lower wind and solar resource at the Canadian onshore renewable facilities.
Sales of $114 million were 17% or $16 million higher than the same quarter of 2023, primarily due to the contribution from the New York onshore wind projects and higher revenue from the Spanish portfolio. Please refer to the MD&A for a further breakdown of Spanish portfolio revenue by component.
Adjusted EBITDA of $78 million was 18% or $12 million higher than the same quarter of 2023, due to the same factors as above.
Natural gas facilities
Electricity production increased 26% or 186GWh compared to the same quarter of 2023, mainly due to higher market demand for dispatchable power.
Sales of $76 million for the three months ended June 30, 2024, were largely in line with the same quarter of 2023.
Adjusted EBITDA of $50 million for the three months ended June 30, 2024, was largely in line with the same quarter of 2023.
Utility
Sales of $91 million for the three months ended June 30, 2024, increased 24% or $18 million compared to the same quarter of 2023, primarily due to the higher market demand, rate escalations and foreign exchange gains as a result of the strengthening of the Colombian peso.
Adjusted EBITDA of $40 million for the three months ended June 30, 2024, increased 34% or $10 million compared to the same quarter of 2023, primarily due to the same factors as above.
Consolidated statement of income (loss)
General and administrative (“G&A”) costs of $25 million in the second quarter decreased $6 million compared to the same quarter of 2023, primarily due to lower payroll costs and non-recurring expenditures.
Development costs of $17 million decreased $11 million compared to the same quarter of 2023, primarily due to focused spending on development activities and timing of the expenditures.
Net finance costs of $98 million in the second quarter increased $16 million compared to the same quarter of 2023, primarily due to the issuance of the Green Subordinated Notes (“Green Notes”) in June 2023, partially offset by scheduled repayments on facility-level loans.
Fair value gain on financial instruments was $82 million, primarily due to net movement in the fair value of derivatives related to interest rate and foreign exchange contracts.
Foreign exchange loss of $6 million in the second quarter was primarily due to unrealized loss from fluctuations in the closing foreign exchange rates.
Other income was $35 million higher than the same quarter of 2023, primarily due to the gain on disposal of La Lucha solar facility, partially offset by lower gains associated with the sale of two offshore wind assets in Europe in 2023.
Net income of $262 million in the second quarter of 2024 compared to net income of $22 million in the same quarter of 2023, was primarily as a result of the factors described above.
Adjusted EBITDA
The following table reconciles net income (loss) to Adjusted EBITDA:
| Three months ended June 30, | Six months ended June 30, | ||||||||||||||
| 2024 | 2023 | 2024 | 2023 | ||||||||||||
| Net income (loss) | $ | 262,356 | $ | 21,662 | $ | 411,653 | $ | 128,799 | |||||||
| Adjustments: | |||||||||||||||
| Finance costs, net | 76,585 | 71,064 | 149,024 | 138,278 | |||||||||||
| Gemini interest income | 1,860 | 4,163 | 3,709 | 6,262 | |||||||||||
| Provision for (recovery of) income taxes | 51,070 | 37,169 | 131,617 | 76,024 | |||||||||||
| Depreciation of property, plant and equipment | 155,967 | 145,882 | 310,028 | 291,057 | |||||||||||
| Amortization of contracts and intangible assets | 14,496 | 14,342 | 28,827 | 28,042 | |||||||||||
| Fair value (gain) loss on derivative contracts | (83,962 | ) | (17,936 | ) | (8 | ) | 63,003 | ||||||||
| Foreign exchange (gain) loss | 5,549 | 4,526 | 1,665 | (24,648 | ) | ||||||||||
| Fair value adjustment relating to disposal group classified as held for sale | — | — | 43,884 | — | |||||||||||
| Elimination of non-controlling interests | (53,719 | ) | (54,042 | ) | (163,914 | ) | (133,009 | ) | |||||||
| Finance lease (lessor) | (1,175 | ) | (1,511 | ) | (2,409 | ) | (2,969 | ) | |||||||
| Share of (profit) loss from joint ventures | (94,644 | ) | 15,327 | (133,452 | ) | 16,469 | |||||||||
| Others (1) | (66,193 | ) | (8,391 | ) | (58,568 | ) | (3,354 | ) | |||||||
| Adjusted EBITDA (2) | $ | 268,190 | $ | 232,255 | $ | 722,056 | $ | 583,954 | |||||||
| (1) Others primarily include Northland’s share of Adjusted EBITDA from equity accounted investees, gain on sale of La Lucha solar facility and other expenses (income). | |||||||||||||||
| (2) See Forward-Looking Statements and Non-IFRS Financial Measures below. | |||||||||||||||
Adjusted EBITDA of $268 million for the three months ended June 30, 2024, increased 15% or $36 million compared to the same quarter of 2023. The significant factors increasing Adjusted EBITDA include:
- $10 million increase in operating results at the offshore wind facilities, primarily due to higher wind resource, as described above;
- $10 million increase in operating results at EBSA, as described above;
- $17 million decrease in development expenditures and G&A costs, as described above;
- $9 million increase due to the contribution of New York Wind onshore wind facilities; and
- $6 million increase in the contribution from the Spanish renewables portfolio, primarily due to higher market revenue, as described above.
The factor partially offsetting the increase in the Adjusted EBITDA was:
- $23 million in gains from partial asset sell-down in 2023.
Adjusted Free Cash Flow and Free Cash Flow
The following table reconciles cash flow from operations to Adjusted Free Cash Flow and Free Cash Flow:
| Three months ended June 30, | Six months ended June 30, | ||||||||||||||
| 2024 | 2023 | 2024 | 2023 | ||||||||||||
| Cash provided by operating activities | $ | 170,998 | $ | 204,278 | $ | 473,414 | $ | 501,340 | |||||||
| Adjustments: | |||||||||||||||
| Net change in non-cash working capital balances related to operations | 114,124 | 55,170 | 298,975 | 135,025 | |||||||||||
| Non-expansionary capital expenditures | (1,326 | ) | (414 | ) | (1,639 | ) | (899 | ) | |||||||
| Restricted funding for major maintenance, debt and decommissioning reserves | (7,677 | ) | (6,811 | ) | (12,165 | ) | (2,653 | ) | |||||||
| Interest | (82,366 | ) | (97,345 | ) | (144,415 | ) | (139,610 | ) | |||||||
| Scheduled principal repayments on facility debt | (270,503 | ) | (274,157 | ) | (329,062 | ) | (325,642 | ) | |||||||
| Funds set aside (utilized) for scheduled principal repayments | 102,073 | 104,016 | (7,874 | ) | (8,166 | ) | |||||||||
| Preferred share dividends | (1,553 | ) | (1,521 | ) | (3,111 | ) | (3,003 | ) | |||||||
| Consolidation of non-controlling interests | (15,741 | ) | (16,670 | ) | (83,591 | ) | (61,653 | ) | |||||||
| Investment income (1) | 6,617 | 9,755 | 13,222 | 17,270 | |||||||||||
| Others (2) | 36,743 | 64,988 | 65,042 | 83,972 | |||||||||||
| Free Cash Flow (3) | $ | 51,389 | $ | 41,289 | $ | 268,796 | $ | 195,981 | |||||||
| Add back: Growth expenditures | 17,205 | 28,859 | 25,529 | 54,237 | |||||||||||
| Less: Historical growth expenditures’ recovery due to sell-down | — | (7,445 | ) | — | (7,445 | ) | |||||||||
| Adjusted Free Cash Flow (3) | $ | 68,594 | $ | 62,703 | $ | 294,325 | $ | 242,773 | |||||||
| (1) Investment income includes Gemini interest income and repayment of Gemini subordinated debt. | |||||||||||||||
| (2) Others mainly include the effect of foreign exchange rates and hedges, interest rate hedge, Nordsee One interest on shareholder loans, share of joint venture project development costs, acquisition costs, lease payments, interest income, Northland’s share of Adjusted Free Cash Flow from equity accounted investees, gain on sale of La Lucha solar facility, interest on corporate-level debt raised to finance capitalized growth projects and other non-cash expenses adjusted in working capital excluded from Free Cash Flow in the period. | |||||||||||||||
| (3) See Forward-Looking Statements and Non-IFRS Financial Measures below. | |||||||||||||||
Adjusted Free Cash Flow of $69 million for the three months ended June 30, 2024, was 9% or $6 million higher than the same quarter of 2023.
The significant factors increasing Adjusted Free Cash Flow were:
- $32 million increase in Adjusted EBITDA (gross of growth expenditures) primarily due to the factors described above; and
- $20 million increase from gain on disposal of La Lucha solar facility.
The factors partially offsetting the increase in Adjusted Free Cash Flow were:
- $19 million increase in current taxes as a result of higher operating results;
- $22 million decrease from foreign exchange and interest rate hedges, and other settlements; and
- $11 million decrease from gain from sales of offshore wind development assets in Europe in 2023.
Free Cash Flow, which is reduced by growth expenditures, totaled $51 million for the three months ended June 30, 2024, and was $10 million higher than the same quarter of 2023, due to the same factors as Adjusted Free Cash Flow.
The following table reconciles Adjusted EBITDA to Adjusted Free Cash Flow.
| Three months ended June 30, | Six months ended June 30, | ||||||||||||||
| 2024 | 2023 | 2024 | 2023 | ||||||||||||
| Adjusted EBITDA (2) | $ | 268,190 | $ | 232,255 | $ | 722,056 | $ | 583,954 | |||||||
| Adjustments: | |||||||||||||||
| Scheduled debt repayments | (137,551 | ) | (144,207 | ) | (276,803 | ) | (283,543 | ) | |||||||
| Interest expense | (57,844 | ) | (54,744 | ) | (96,788 | ) | (99,160 | ) | |||||||
| Current taxes | (36,368 | ) | (17,694 | ) | (106,120 | ) | (64,690 | ) | |||||||
| Non-expansionary capital expenditure | (1,189 | ) | (413 | ) | (1,461 | ) | (720 | ) | |||||||
| Utilization (funding) of maintenance and decommissioning reserves | (7,302 | ) | (6,347 | ) | (10,979 | ) | (2,645 | ) | |||||||
| Lease payments, including principal and interest | (317 | ) | (1,464 | ) | (3,381 | ) | (4,529 | ) | |||||||
| Preferred dividends | (1,553 | ) | (1,521 | ) | (3,111 | ) | (3,003 | ) | |||||||
| Foreign exchange hedge gain (loss) | (3,086 | ) | 6,830 | 12,891 | 30,288 | ||||||||||
| Others (1) | 28,409 | 28,594 | 32,492 | 40,029 | |||||||||||
| Free Cash Flow (2) | $ | 51,389 | $ | 41,289 | $ | 268,796 | $ | 195,981 | |||||||
| Add Back: Growth expenditures | 17,205 | 28,859 | 25,529 | 54,237 | |||||||||||
| Less: Historical growth expenditures’ recovery due to sell-down | — | (7,445 | ) | — | (7,445 | ) | |||||||||
| Adjusted Free Cash Flow (2) | $ | 68,594 | $ | 62,703 | $ | 294,325 | $ | 242,773 | |||||||
| (1) Others mainly include repayment of Gemini subordinated debt, gain on sale of La Lucha solar facility, interest rate and foreign currency hedge settlements, and interest received on third-party loans to partners. | |||||||||||||||
| (2) See Forward-Looking Statements and Non-IFRS Financial Measures below. | |||||||||||||||
Significant Events and Updates
Balance Sheet:
- La Lucha Solar Facility Sale – On June 28, 2024, Northland completed the sale of its 100% stake in the La Lucha solar facility to Cometa Energía, S.A. de C.V., wholly owned by Saavi Energía (“Saavi”) for approximately $215 million in cash after taxes, transaction fees and other customary adjustments. La Lucha is a 130MW solar facility located in Durango, Mexico. The facility achieved commercial operations in June 2023. A gain on disposal of $20 million was recorded in Adjusted Free Cash Flow and Free Cash Flow.
Renewables Growth:
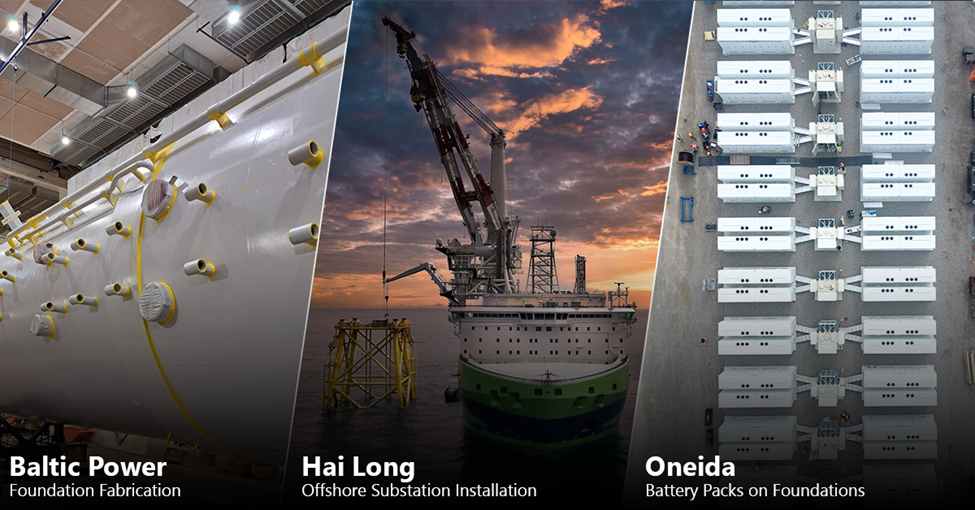
- Construction Update on Hai Long, Baltic Power, and Oneida – The Hai Long project continues to make progress with the fabrication of foundations, cables, and onshore and offshore substations. The onshore construction work has advanced well and is nearing mechanical completion. Offshore construction is advancing, with this quarter marking the completion of installation of offshore substation foundation jackets, the first offshore substation topside and continuing with pin piles installations at multiple turbine locations. Hai Long 2A and 2B pin pile installation is expected to be completed by the end of the third quarter. The pre-fabrication for the first batch of turbine components including towers, generators and nacelles is progressing well, with multiple parts en route to Taiwan. Full commercial operations are expected to commence in 2026/2027, according to schedule. Overall project cost is aligned with original expectations.
The Baltic Power project continues to make progress on fabrication of onshore and offshore substations, foundations, export cables, multiple turbine components and inter array cables. Construction of an onshore substation and the operations and management building are well underway. Major in-water offshore construction activity is expected to start in early 2025. Full commercial operations are expected to commence in the latter half of 2026, according to schedule. Overall project cost is aligned with original expectations.
The Oneida project continues to make progress with its construction activities. All the battery packs and medium-voltage transformers have been delivered and cabling installation continues across the site. The high-voltage transformers arrived in Canada and are expected to arrive at site in the third quarter. Full commercial operations are expected to commence in 2025, according to schedule. Overall project cost is aligned with original expectations.
- Other Growth Activity – Northland continues to make progress on its development activities in core markets for onshore renewables including Alberta, Ontario, and New York, and offshore wind including Scotland and South Korea. For example, Northland signed a 15-year bilateral offtake agreement for 100% of the battery energy storage capacity from the Jurassic Battery Energy Storage System (“Jurassic BESS”) project in Alberta with members of the Alberta Schools Commodities Purchasing Consortium. This is the first offtake agreement of its kind in Canada for a battery storage project and is a key milestone in the advancement of Northland’s Alberta portfolio.
2024 Financial Outlook
Northland’s outlook is underpinned by its commitment to operational excellence, prudent growth in key global markets and focus on the Company's three major renewable construction programs, ensuring their successful execution.
To prepare for further growth, the Company also continues to be active in pursuing various development opportunities in its core markets. The Company has allocated $60 million of development expenditures in 2024 towards advancing the 9GW of development opportunities in markets including Alberta, New York, Ontario, Scotland, South Korea and other select jurisdictions.
As of August 14, 2024, management’s 2024 financial outlook remains unchanged from prior guidance. This outlook reflects Northland’s commitment to strong operational performance with key financial projections for 2024 including expected Adjusted EBITDA in the range of $1.2 billion to $1.3 billion and Adjusted Free Cash Flow per share to be in the range of $1.30 to $1.50. Furthermore, projected Free Cash Flow per share for 2024 is expected to be in the range of $1.10 to $1.30, reflecting the Company’s commitment to prudent financial management. Due to strong operating results experienced in the first half of 2024, management is currently projecting the financial outlook for 2024 to be at the higher end of the disclosed guidance range.
It is important to note that while Northland is confident in its outlook, it remains subject to the Forward-Looking Statements set forth herein as well as the Risk Factors outlined in Northland’s most recent Annual Information Form dated February 21, 2024 (“2023 AIF”).
Second-Quarter Earnings Conference Call
Northland will hold an earnings conference call on August 15, 2024, to discuss its second quarter 2024 results. The call will be hosted by Northland’s Senior Management, who will discuss the Company’s financial results and developments as well as answering questions from analysts.
Conference call details are as follows:
Thursday, August 15, 2024, 10:00 a.m. ET
Participants wishing to join the call and ask questions must register using the following URL below:
https://register.vevent.com/register/BI78c9f1b1d17e47499242d1b1147e8571
For all other attendees, the call will be broadcast live on the internet, in listen-only mode and can be accessed using the following link:
Webcast URL: https://edge.media-server.com/mmc/p/qinx7csg
For those unable to attend the live call, an audio recording will be available on northlandpower.com on Friday, August 16, 2024.
Northland’s unaudited interim condensed consolidated financial statements for the three and six months ended June 30, 2024, and related Management’s Discussion and Analysis can be found on SEDAR+ at www.sedarplus.ca under Northland’s profile and on northlandpower.com.
ABOUT NORTHLAND POWER
Northland Power is a global power producer dedicated to helping the clean energy transition by producing electricity from clean renewable resources. Founded in 1987, Northland has a long history of developing, building, owning and operating clean and green power infrastructure assets and is a global leader in offshore wind. In addition, Northland owns and manages a diversified generation mix including onshore renewables, natural gas energy, as well as supplying energy through a regulated utility.
Headquartered in Toronto, Canada, with global offices in eight countries, Northland owns or has an economic interest in approximately 3.2GW (net 2.8GW) of operating capacity. The Company also has a significant inventory of projects in construction and in various stages of development encompassing approximately 12GW of potential capacity.
Publicly traded since 1997, Northland's common shares, Series 1 and Series 2 preferred shares trade on the Toronto Stock Exchange under the symbols NPI, NPI.PR.A and NPI.PR.B, respectively.
NON-IFRS FINANCIAL MEASURES
This press release includes references to the Company’s adjusted earnings before interest, income taxes, depreciation and amortization (“Adjusted EBITDA”), Adjusted Free Cash Flow, Free Cash Flow and applicable payout ratios and per share amounts, which are measures not prescribed by International Financial Reporting Standards (“IFRS”), and therefore do not have any standardized meaning under IFRS and may not be comparable to similar measures presented by other companies. Non-IFRS financial measures are presented at Northland’s share of underlying operations. These measures should not be considered alternatives to net income (loss), cash flow from operating activities or other measures of financial performance calculated in accordance with IFRS. Rather, these measures are provided to complement IFRS measures in the analysis of Northland’s results of operations from management’s perspective. Management believes that Northland’s non-IFRS financial measures and applicable payout ratio and per share amounts are widely accepted and understood financial indicators used by investors and securities analysts to assess the performance of a company, including its ability to generate cash through operations.
FORWARD-LOOKING STATEMENTS
This press release contains statements that constitute forward-looking information within the meaning of applicable securities laws (“forward-looking statements”) that are provided for the purpose of presenting information about management’s current expectations and plans. Readers are cautioned that such statements may not be appropriate for other purposes. Northland’s actual results could differ materially from those expressed in, or implied by, these forward-looking statements and, accordingly, the events anticipated by the forward-looking statements may or may not transpire or occur. Forward-looking statements include statements that are not historical facts and are predictive in nature, depend upon or refer to future events or conditions, or include words such as “expects,” “anticipates,” “plans,” “predicts,” “believes,” “estimates,” “intends,” “targets,” “projects,” “forecasts” or negative versions thereof and other similar expressions or future or conditional verbs such as “may,” “will,” “should,” “would” and “could.” These statements may include, without limitation, statements regarding future Adjusted EBITDA, Adjusted Free Cash Flow and Free Cash Flow, including respective per share amounts, dividend payments and dividend payout ratios, the timing for and attainment of the Hai Long and Baltic Power offshore wind and Oneida energy storage projects and other renewables growth activity, and the anticipated contributions therefrom to Adjusted EBITDA, Adjusted Free Cash Flow and Free Cash Flow, the expected generating capacity of certain projects, guidance, anticipated dates of full commercial operations, forecasts as to overall project costs, the completion of construction, acquisitions, dispositions, whether partial or full, investments or financings and the timing thereof, the timing for and attainment of financial close and commercial operations for each project, the potential for future production from project pipelines, cost and output of development projects, the all-in interest cost for debt financing, the impact of currency and interest rate hedges, litigation claims, anticipated results from the optimization of the Thorold Co-Generation facility and the timing related thereto, future funding requirements, and the future operations, business, financial condition, financial results, priorities, ongoing objectives, strategies and the outlook of Northland, its subsidiaries and joint ventures. These statements are based upon certain material factors or assumptions that were applied in developing the forward-looking statements, including the design specifications of development projects, the provisions of contracts to which Northland or a subsidiary is a party, management’s current plans and its perception of historical trends, current conditions and expected future developments, the ability to obtain necessary approvals, satisfy any closing conditions, satisfy any project finance lender conditions to closing sell-downs or obtain adequate financing regarding contemplated construction, acquisitions, dispositions, investments or financings, as well as other factors, estimates and assumptions that are believed to be appropriate in the circumstances. Although these forward-looking statements are based upon management’s current reasonable expectations and assumptions, they are subject to numerous risks and uncertainties. Some of the factors that could cause results or events to differ from current expectations include, but are not limited to, risks associated with further regulatory and policy changes in Spain which could impair current guidance and expected returns, risks associated with merchant pool pricing and revenues, risks associated with sales contracts, the emergence of widespread health emergencies or pandemics, Northland’s reliance on the performance of its offshore wind facilities at Gemini, Nordsee One and Deutsche Bucht for over 50% of its Adjusted EBITDA, counterparty and joint venture risks, contractual operating performance, variability of sales from generating facilities powered by intermittent renewable resources, wind and solar resource risk, unplanned maintenance risk, offshore wind concentration, natural gas and power market risks, commodity price risks, operational risks, recovery of utility operating costs, Northland’s ability to resolve issues/delays with the relevant regulatory and/or government authorities, permitting, construction risks, project development risks, integration and acquisition risks, procurement and supply chain risks, financing risks, disposition and joint-venture risks, competition risks, interest rate and refinancing risks, liquidity risk, inflation risks, commodity availability and cost risk, construction material cost risks, impacts of regional or global conflicts, credit rating risk, currency fluctuation risk, variability of cash flow and potential impact on dividends, taxation, natural events, environmental risks, climate change, health and worker safety risks, market compliance risk, government regulations and policy risks, utility rate regulation risks, international activities, cybersecurity, data protection and reliance on information technology, labour relations, labour shortage risk, management transition risk, geopolitical risk in and around the regions Northland operates in, large project risk, reputational risk, insurance risk, risks relating to co-ownership, bribery and corruption risk, terrorism and security, litigation risk and legal contingencies, and the other factors described in the “Risks Factors” section of Northland’s Management’s Discussion and Analysis and Annual Information Form for the year ended December 31, 2023, which can be found at www.sedarplus.ca under Northland’s profile and on Northland’s website at northlandpower.com. Northland has attempted to identify important factors that could cause actual results to materially differ from current expectations; however, there may be other factors that cause actual results to differ materially from such expectations. Northland’s actual results could differ materially from those expressed in, or implied by, these forward-looking statements and, accordingly, no assurances can be given that any of the events anticipated by the forward-looking statements will transpire or occur, and Northland cautions you not to place undue reliance upon any such forward-looking statements.
The forward-looking statements contained in this release are, unless otherwise indicated, stated as of the date hereof and are based on assumptions that were considered reasonable as of the date hereof. Other than as specifically required by law, Northland undertakes no obligation to update any forward-looking statements to reflect events or circumstances after such date or to reflect the occurrence of unanticipated events, whether as a result of new information, future events or results, or otherwise.
Certain forward-looking information in this release and the MD&A may also constitute a “financial outlook” within the meaning of applicable securities laws. Financial outlook involves statements about Northland’s prospective financial performance, financial position or cash flows and is based on and subject to the assumptions about future economic conditions and courses of action and the risk factors described above in respect of forward-looking information generally, as well as any other specific assumptions and risk factors in relation to such financial outlook noted in this release and the MD&A. Such assumptions are based on management’s assessment of the relevant information currently available and any financial outlook included in this release and the MD&A is provided for the purpose of helping readers understand Northland’s current expectations and plans for the future. Readers are cautioned that reliance on any financial outlook may not be appropriate for other purposes or in other circumstances and that the risk factors described above or other factors may cause actual results to differ materially from any financial outlook. The actual results of Northland’s operations will likely vary from the amounts set forth in any financial outlook and such variances may be material.
For further information, please contact:
Dario Neimarlija, Vice President, FP&A and Investor Relations
647-288-1019
investorrelations@northlandpower.com
northlandpower.com
A photo accompanying this announcement is available at https://www.globenewswire.com/NewsRoom/AttachmentNg/75bb65ef-c5b6-45a7-a069-73e96fcec7fa
