TORONTO, Sept. 04, 2024 (GLOBE NEWSWIRE) -- PTX Metals Inc. (CSE: PTX) (OTCQB: PANXF, Frankfurt: 9PX) (“PTX” or the “Company”), a minerals exploration Company with two flagship projects situated in northern Ontario, is pleased to provide the results of a technical report summarizing the Exploration Target model estimate for the 100% owned W2 Cu-Ni-PGE Project in Ontario which outlines a large scale near-surface Cu-Ni-PGE project near the Ring of Fire area, Ontario.
The Company’s 3D geological and grade shell modelling of historic and recent drilling results indicates a near-surface exploration target of approximately 59-135 million tonnes (“Mt”) averaging between 0.78% to 1.03% CuEq, containing some 610,000 tonnes to 1,052,000 tonnes Copper Equivalent (“CuEq”) (using CuEq grade higher than 0.7% and 0.5%, respectively). This is equivalent to 1.34 billion to 2.3 billion pounds Copper Equivalent.
Using CuEq grade higher than 0.9%, the exploration target estimation is 31 million tonnes at 1.25% CuEq.
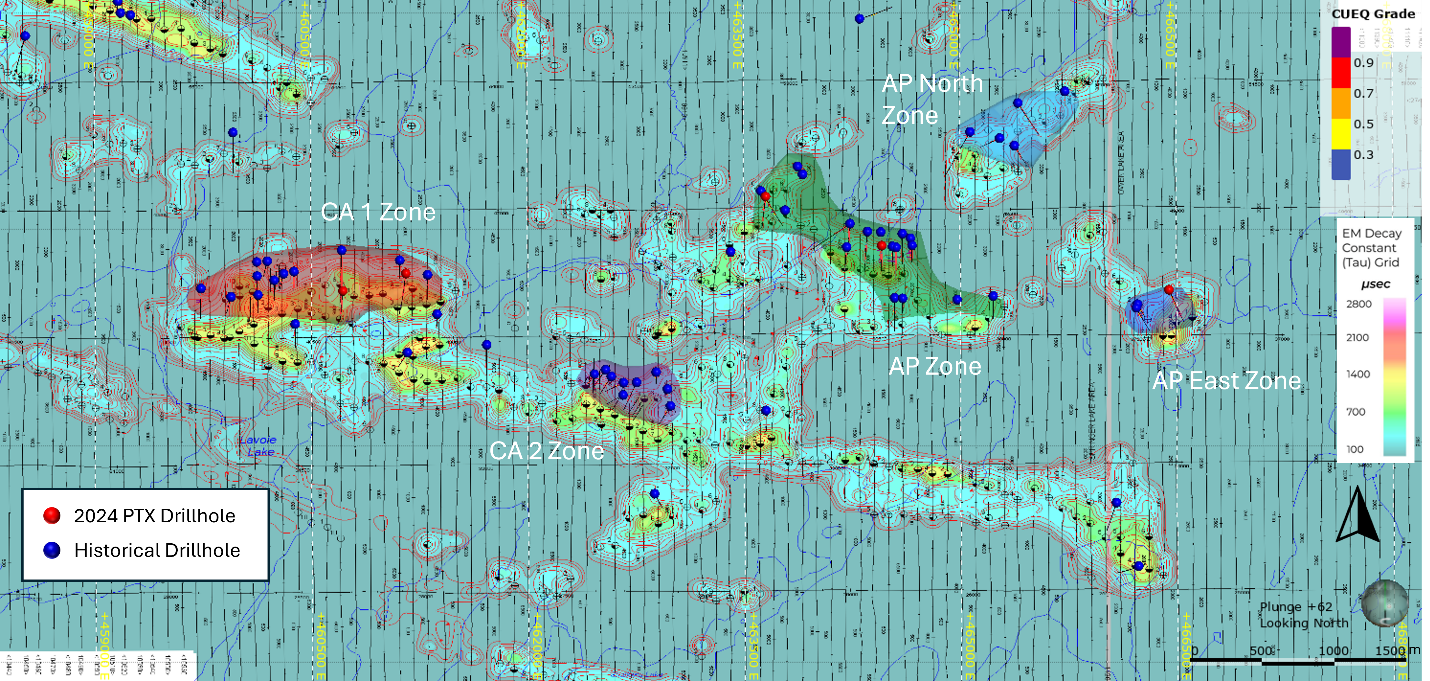
In total, five mineralization zones - CA Zone 1, CA Zone 2, AP Main and two satellite zones (AP North and AP East) were defined from the Exploration Targets models (Figure 1). The five mineralization zones have an extended strike length of approximately 7 km and are mostly near surface (<150m deep), but open at depth. All drillhole databases were compiled into The GEOVIA GEMS database which consisted of 98 drill holes totalling 16,841 metres completed by Inco, Aurora Platinum, and PTX Metals.
Highlight of the Results:
- The recently acquired CA Zones (CA Zone 1 and CA Zone 2) are estimated to have a potential for 24 million tonnes at 0.98% Cu Eq (using CuEq grader higher than 0.7%).
- The CA Zone 2 located to the southeast reported the highest grade of 2 MT at 1.42% CuEq (using grade higher than 0.9% CuEq for estimation).
- Higher PGEs (Pd, Pt etc.) are noted in the AP Main Zone, which is estimated to have a potential for 20 million tonnes at 1.25% CuEq using grade higher than 0.9% CuEq for estimation.
- There are many undrilled conductors throughout the property (Figure 1) and the 2024 phase 1 drilling revealed zones of previously unknown mineralization over wide widths across a 7 km strike on the property.
- In addition, the 2024 Phase 1 drilling was successful in confirming mineralization.
- Next steps for the project include confirmation drilling principally where Inco drilled in the CA zones and infill drilling in the AP zone, metallurgy and further community engagement. All of these activities should enhance confidence in the deposit potential and considerably derisk the project.
“We are delighted with the results of this initial work showing the significant scale of the W2 project and the potential to become a mining project of significance,” said Greg Ferron, CEO and President of PTX Metals Inc. “The tonnage and grade reported substantially benefitted from the high-quality drilling completed by Inco, Aurora Platinum and PTX. We remain confident that confirmation drilling and continued exploration will both upgrade and expand resources.”
All historical drill core and some collar location and survey results are not able to be traced at the moment. In addition, a portion of the historical drilling assay data predates the implementation of NI 43-101. This was the rationale for estimating the model as an Exploration Target.
The sensitivity to the selection of a reporting estimated CuEq grade are demonstrated below:
| Table 1 Exploration Target Estimate sensitivity | ||||||||||||||||
| Zone | Grade | Tonnage | Cu | Cu | Ni | Ni | Co | Co | Au | Au | Pt | Pt | Pd | Pd | CuEq | CuEq |
| CuEq% | mt | % | kt | % | kt | % | kt | g/t | koz | g/t | koz | g/t | koz | % | kt | |
| CA1 | > 0.9 | 8 | 0.41 | 31 | 0.20 | 15 | 0.035 | 2.6 | 0.13 | 31 | 0.13 | 31 | 0.19 | 45 | 1.20 | 91 |
| > 0.7 | 20 | 0.33 | 67 | 0.14 | 29 | 0.023 | 4.8 | 0.11 | 74 | 0.12 | 82 | 0.18 | 120 | 0.93 | 191 | |
| >0.5 | 60 | 0.24 | 147 | 0.10 | 60 | 0.017 | 9.9 | 0.09 | 169 | 0.11 | 217 | 0.15 | 298 | 0.70 | 421 | |
| >0.3 | 135 | 0.18 | 243 | 0.07 | 101 | 0.013 | 17.2 | 0.07 | 287 | 0.09 | 398 | 0.13 | 547 | 0.53 | 718 | |
| CA2 | >0.9 | 2 | 0.33 | 7 | 0.29 | 6 | 0.039 | 0.8 | 0.14 | 10 | 0.13 | 9 | 0.38 | 26 | 1.42 | 30 |
| >0.7 | 4 | 0.25 | 10 | 0.21 | 8 | 0.029 | 1.2 | 0.16 | 21 | 0.11 | 14 | 0.34 | 44 | 1.12 | 45 | |
| > 0.5 | 8 | 0.19 | 16 | 0.15 | 12 | 0.020 | 1.7 | 0.13 | 35 | 0.10 | 26 | 0.27 | 72 | 0.84 | 71 | |
| >0.3 | 16 | 0.15 | 24 | 0.11 | 17 | 0.015 | 2.3 | 0.10 | 50 | 0.08 | 39 | 0.20 | 103 | 0.63 | 100 | |
| AP | >0.9 | 20 | 0.29 | 57 | 0.22 | 44 | 0.011 | 2.1 | 0.11 | 71 | 0.17 | 107 | 0.66 | 416 | 1.25 | 247 |
| >0.7 | 30 | 0.25 | 76 | 0.19 | 59 | 0.010 | 3.2 | 0.09 | 86 | 0.15 | 148 | 0.57 | 554 | 1.09 | 331 | |
| >0.5 | 52 | 0.20 | 103 | 0.16 | 82 | 0.010 | 5.1 | 0.06 | 106 | 0.13 | 212 | 0.46 | 759 | 0.88 | 456 | |
| >0.3 | 84 | 0.15 | 131 | 0.13 | 107 | 0.009 | 7.6 | 0.05 | 127 | 0.10 | 281 | 0.35 | 957 | 0.69 | 586 | |
| AP_East | >0.9 | 2 | 0.42 | 7 | 0.28 | 5 | 0.013 | 0.2 | 0.01 | 0 | 0.06 | 3 | 0.36 | 19 | 1.26 | 21 |
| >0.7 | 4 | 0.32 | 12 | 0.22 | 8 | 0.011 | 0.4 | 0.01 | 1 | 0.05 | 6 | 0.28 | 34 | 0.99 | 37 | |
| >0.5 | 12 | 0.22 | 26 | 0.16 | 19 | 0.009 | 1.0 | 0.01 | 4 | 0.04 | 16 | 0.20 | 77 | 0.71 | 86 | |
| >0.3 | 24 | 0.17 | 41 | 0.13 | 31 | 0.007 | 1.6 | 0.01 | 6 | 0.04 | 28 | 0.16 | 124 | 0.56 | 136 | |
| AP_North | >0.9 | 0 | 0.42 | 0 | 0.14 | 0 | 0.028 | 0.0 | 0.01 | 0 | 0.02 | 0 | 0.25 | 1 | 0.95 | 1 |
| >0.7 | 1 | 0.29 | 2 | 0.13 | 1 | 0.021 | 0.1 | 0.01 | 0 | 0.03 | 1 | 0.24 | 5 | 0.78 | 5 | |
| >0.5 | 3 | 0.20 | 6 | 0.11 | 4 | 0.016 | 0.5 | 0.01 | 1 | 0.04 | 4 | 0.19 | 19 | 0.62 | 19 | |
| >0.3 | 24 | 0.13 | 31 | 0.07 | 18 | 0.010 | 2.4 | 0.01 | 11 | 0.04 | 33 | 0.14 | 107 | 0.41 | 101 | |
| Total | >0.9 | 31 | 0.33 | 103 | 0.22 | 69 | 0.019 | 5.8 | 0.11 | 111 | 0.15 | 149 | 0.51 | 507 | 1.25 | 389 |
| >0.7 | 59 | 0.28 | 167 | 0.18 | 105 | 0.016 | 9.7 | 0.10 | 182 | 0.13 | 251 | 0.40 | 757 | 1.03 | 610 | |
| >0.5 | 135 | 0.22 | 298 | 0.13 | 177 | 0.013 | 18.2 | 0.07 | 315 | 0.11 | 475 | 0.28 | 1,225 | 0.78 | 1,052 | |
| >0.3 | 284 | 0.16 | 469 | 0.10 | 274 | 0.011 | 31.2 | 0.05 | 480 | 0.09 | 779 | 0.20 | 1,838 | 0.58 | 1,641 | |
The exploration target modeling work followed the guidelines set forth in National Instrument 43-101, Section 14 resource estimate, and will also be used to inform further exploration drill program strategies at W2 such as confirmation drilling and in-fill drilling. The potential grade and tonnage of the exploration target model is conceptual in nature, and more work and information, including drilling, are required before fulfilling CIM (Canadian Institute of Mining, Metallurgy, and Petroleum) requirements for the disclosure of an eventual mineral resource. At this stage, it is uncertain if further exploration will result in the Exploration Target being delineated as a Mineral Resource. In addition, important aspects such as metallurgical processing options need to be investigated to evaluate potential recoveries in the mineralized zones.
Methodology
The Exploration Target has been completed by BAW Mining Inc., a consultant independent of the Company and has been completed in accordance with National Instrument 43-10 – Standards of Disclosure for Mineral Projects (“NI 43-101). The completed NI 43-101 technical report will be filed on Sedar and Company’s website within 45 days of the date of this news release.
Five mineralization zones - CA Zone 1, CA Zone 2, AP Main and two satellite zones (AP North and AP East) were determined from the Exploration Targets (Figure 1). The five mineralization zones have an extended strike length of approximately 7 km and are mostly near surface (<150m deep), but open to depth. The mineralized zones were estimated by generating 3-D grade-shell geological and mineralization wireframes using 7 drill holes completed by PTX in 2024 and historical drill holes which were collected and digitized from various documents. The entire drillhole databases were compiled into The GEOVIA GEMS™ V6.8.4 database which consisted of 98 drill holes totalling 16,841 metres.
| Table 2 W2 Drill Hole Database Summary | |||||
| Year Drilled | # Of Drill Holes | Drill Hole Length (m) | # Of Holes Used for ET Reporting | Length Of Holes Used for ET Reporting (m) | # Of Assayed Drill Holes |
| 2024 | 7 | 1,545 | 5 | 1,189 | 7 |
| Historical | 91 | 15,296 | 46 | 8,386 | 61 |
| Total | 98 | 16,841 | 51 | 9,575 | 68 |
Based on the available lithology and assay information, the mineralization is hosted mostly within gabbro. A gabbro 3D model was created using a regional geological map, drill hole lithology and assay data available within the PTX claims. The mineralization wireframe was refined from grade boundary interpretation constrained within the gabbro from visual inspection of drill hole sections. The outlines were influenced by the selection of mineralized material above 0.3% copper equivalence (CuEq) that demonstrated a lithological and structural zonal continuity along strike and down dip. The CuEq was calculated with the formula below:
*CuEq%=Cu%+(2.212*Ni%)+(3.658*Co%)+(0.435*Pd g/t)+(0.365*Pt g/t)+(0.770*Au g/t)
The CuEq was determined with metal prices only and metallurgical recovery was not estimated since no metallurgical test has been done to date on the project.
The database contains lithology of all drill holes and assays of 68 holes (see Table 2). Drill hole locations are shown in Figure 1. The collar elevation (Z) of the historical holes were pressed onto the topographic surface created based on the USGS Shuttle Radar Topography Mission (SRTM) digital elevation data as the elevation were not available in the source documents.
Metal prices are based on a one-year trailing average as of April 30, 2024, as follows:
| Cu Price | US$3.82/lb | |
| Ni Price | US$8.45/lb | |
| Co Price | US$13.97/lb | |
| Pd Price | US$1,138/oz | |
| Pt Price | US$957/oz | |
| Au Price | US$2,016/oz |
The minimum constrained sample length for the wireframes was 2.0 m. In some cases, mineralization below 0.3% CuEq was included for the purpose of maintaining zonal continuity and minimum width.
Five mineralization zones (CA1, CA2, AP, AP_North and AP_East) were determined for the Exploration Targets with a minimum of three assay holes spacing less than 500 m, extending 100 m from the outmost holes into untested territories. Most drillholes, especially in the CA zones, have tighter drilling hole spacing than the minimum drillhole spacing above. The 3-D domains are presented in Figure 1. To estimate the tonnage of the mineralized zones, a specific gravity (“SG”) of 3 t/m3 was assumed as there weren’t any bulk density measurements available to this study.
The surfaces of topography and overburden were created with USGS SRTM elevation data and drill hole logs, and the mineralization domains were truncated to the overburden surface.
The grade blocks of Cu, Ni, Co, Pd, Pt and Au were interpolated with Inverse Distance Squared (“ID2”). Nearest Neighbour (“NN”) was employed for validation. Multiple passes were executed for the grade interpolation to progressively capture the sample points to avoid over-smoothing and preserve local grade variability. Search ranges and directions were based on the variograms.
W2 Exploration Potential
The Company intends to test the validity of the Exploration Target models in future exploration programs on the Project. Systematic diamond drilling (NQ core size) of the known mineralized zones together with geophysical surveys to prioritize targets will be conducted and extended over a several-year period. Primary focus will be:
- Confirmation and infill drilling in both CA and AP zone.
- Exploration drilling for expansion along strike and at depth in both CA and AP zone.
- Exploration drilling in the transition area between the five zones.
- Drill testing numerous previously undrilled EM conductors on the property.
- More detailed airborne and ground geophysical surveys, such as Mag and EM surveys and interpretation.
Figure 1: W2 Exploration Target Zones
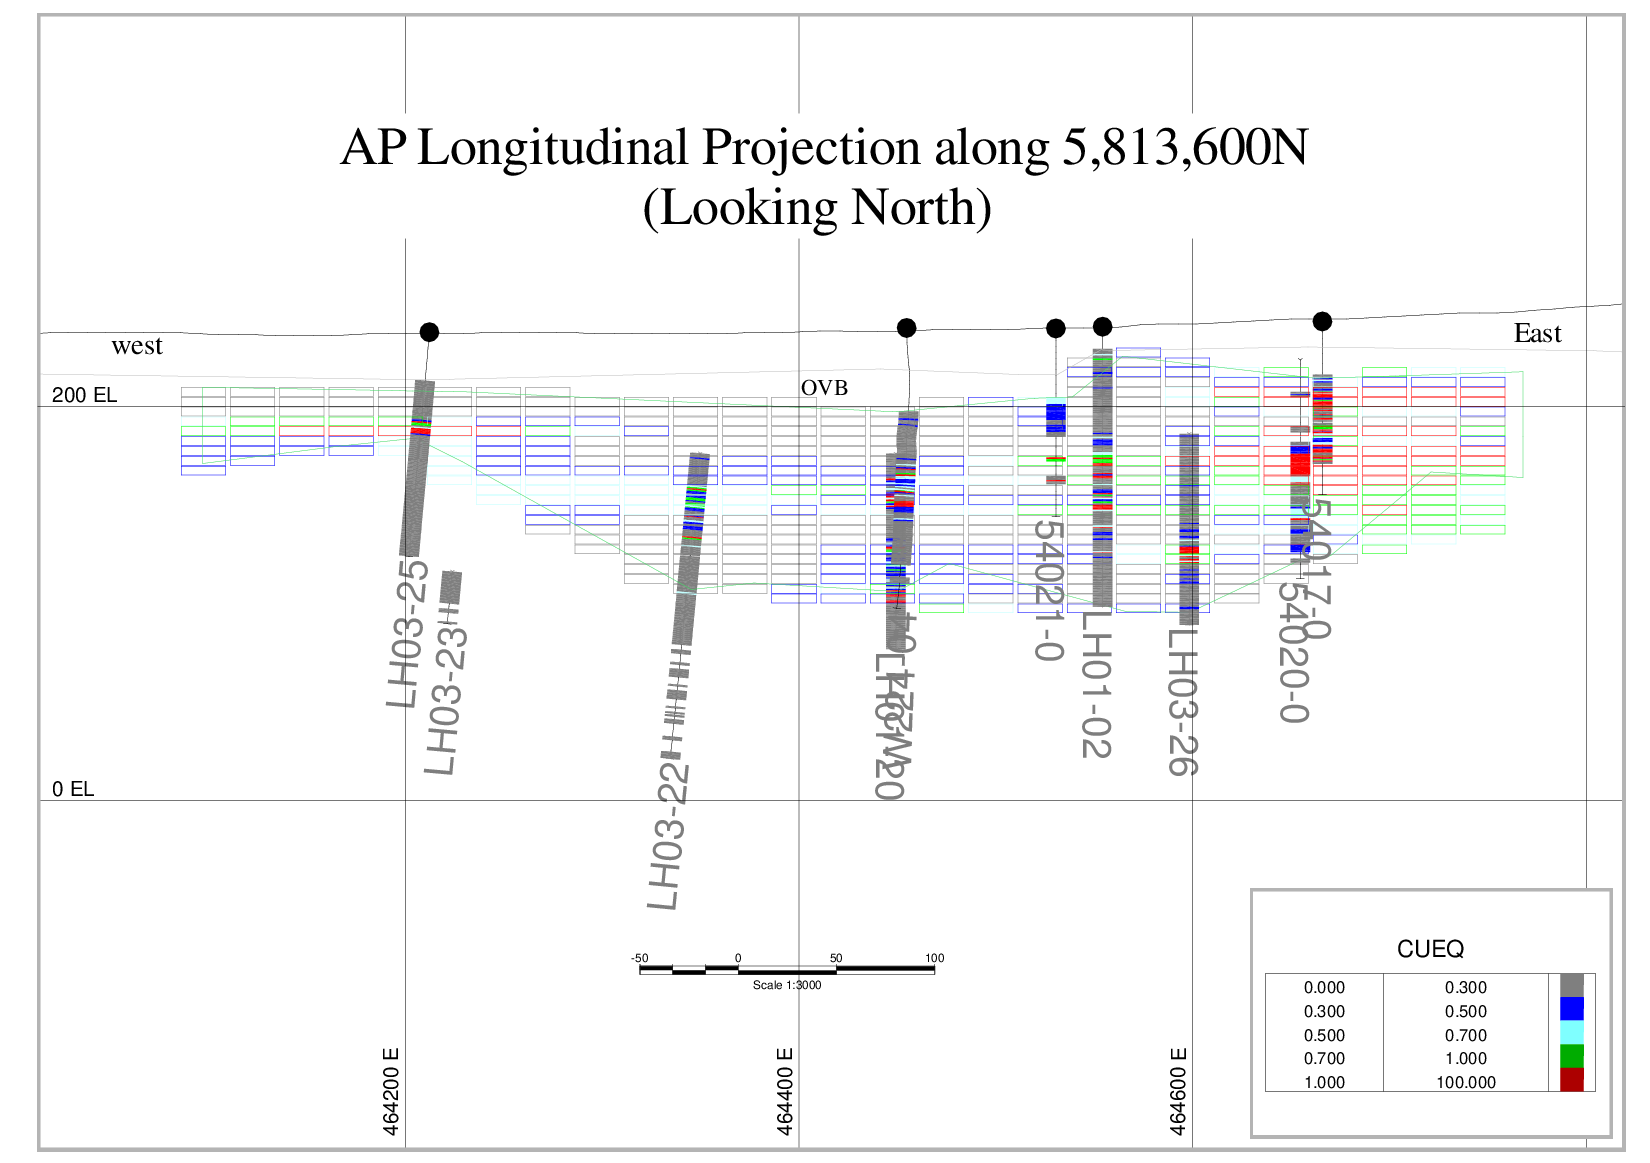
Selected cross-sections of the CuEq blocks are presented in Figure 2 and 3.
Figure 2: CA1 Zone Longitudinal Projection
(CuEq Block vs Drill Hole)
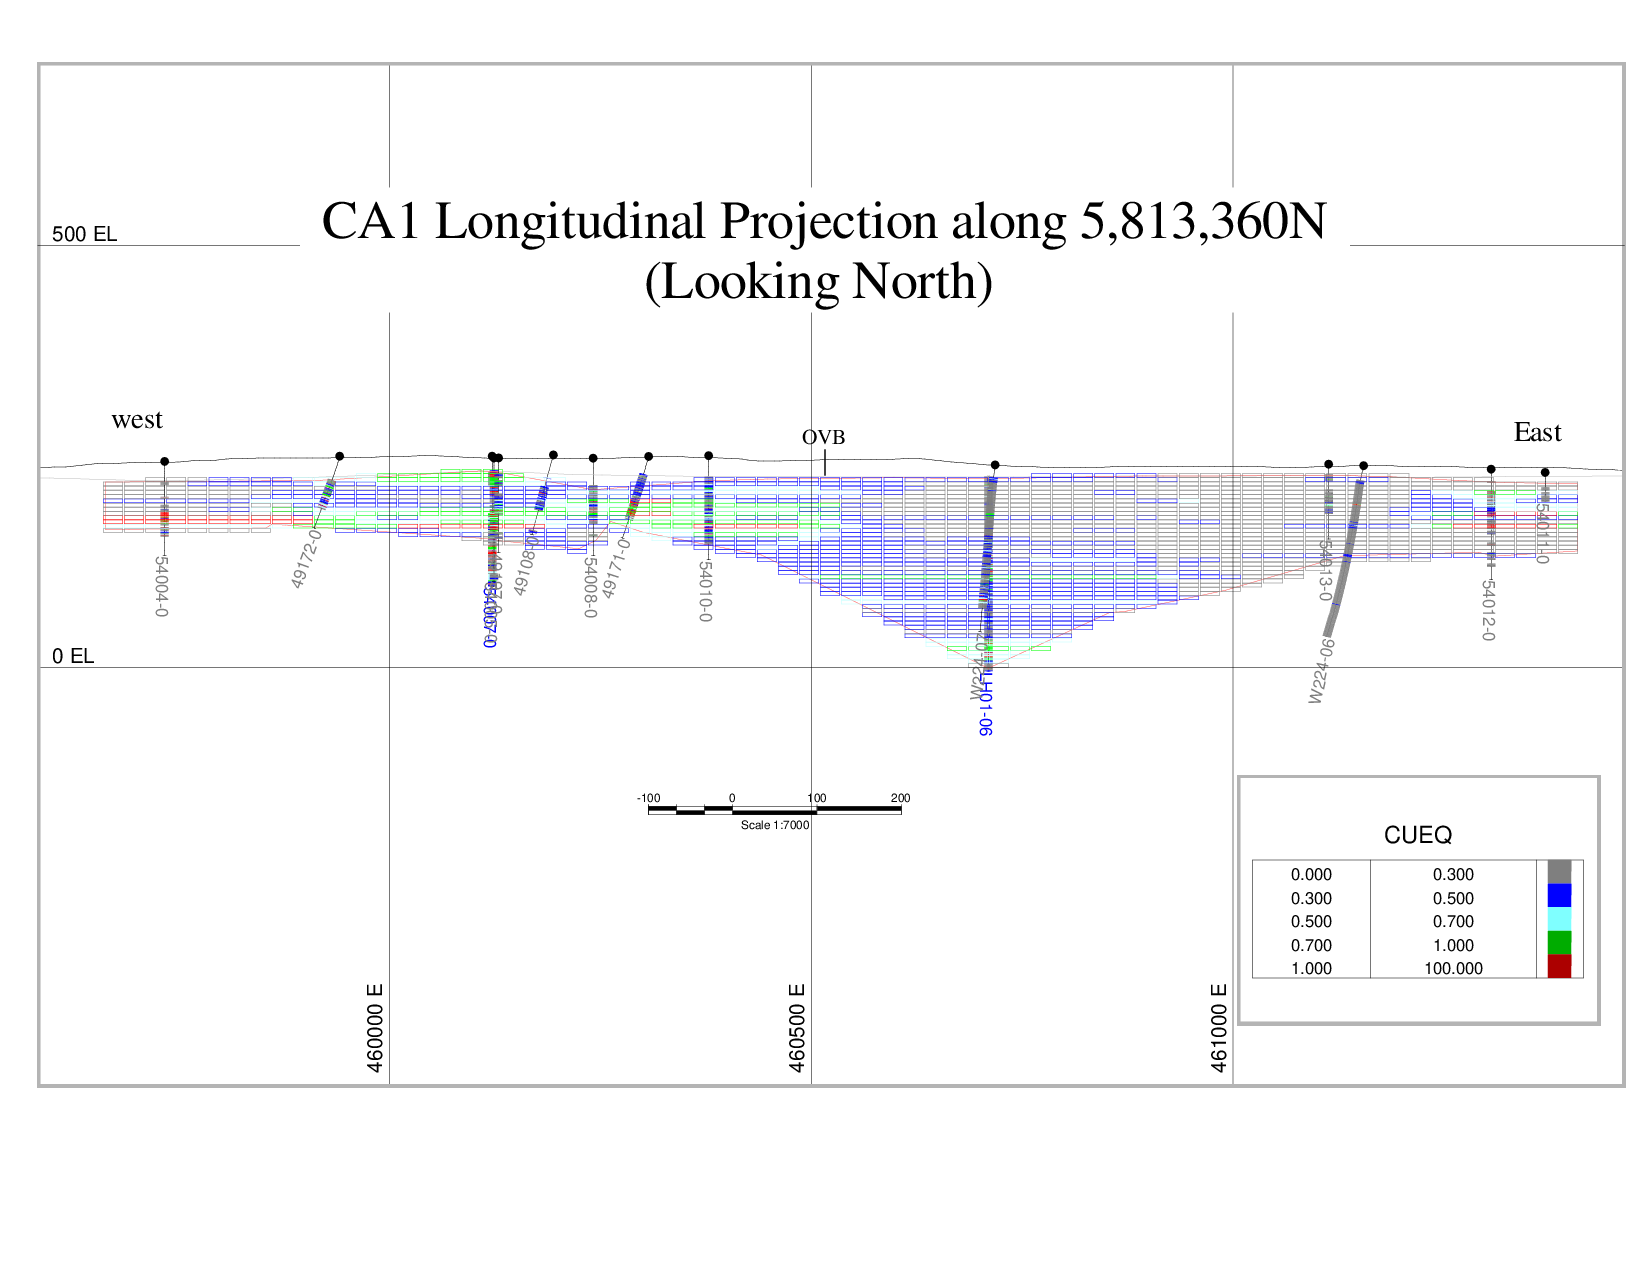
Figure 3: AP Zone Longitudinal Projection
(CuEq Block vs Drill Hole)
Qualified Person
The technical information presented in this news release has been reviewed and approved by Yungang Wu, P. Geo and Shuda Zhou P. Geo who are qualified persons as defined by National Instrument 43-101, Standards of Disclosure for Mineral Projects.
About PTX Metals Inc.
PTX Metals is a minerals exploration Company with two flagship projects situated in northern Ontario, renowned as a world-class mining jurisdiction for its abundance of mineral resources and investment opportunities. The corporate objective is to advance the exploration programs towards proving the potential of each asset, which includes the W2 Copper Nickel PGE Project and South Timmins Joint Venture Gold Projects.
The portfolio of assets offers investors exposure to some of the world’s most valuable metals including gold, as well as essential metals critical for the clean energy transition: copper, nickel, uranium and rare metals. The projects were acquired for their geologically favorable attributes, and proximity to established mining producers. PTX work programs are designed by a team of expert geologists with extensive career knowledge gained from their tenure working for global mining companies in northern Ontario.
PTX Metals is based in Toronto, Canada, with a primary listing on the Canadian Securities Exchange under the symbol PTX. The company is also listed in Frankfurt under the symbol 9PF and on the OTCQB in the United States as PANXF.
For additional information on PTX Metals, please visit the Company’s website at https://ptxmetals.com/.
For further information, please contact:
Greg Ferron, President and Chief Executive Officer
Phone: 416-270-5042
Email: gferron@ptxmetals.com
Forward-Looking Information
This news release contains forward-looking information which is not comprised of historical facts. Forward-looking information is characterized by words such as “plan”, “expect”, “project”, “intend”, “believe”, “anticipate”, “estimate” and other similar words, or statements that certain events or conditions “may” or “will” occur. Forward-looking information involves risks, uncertainties and other factors that could cause actual events, results, and opportunities to differ materially from those expressed or implied by such forward-looking information. Factors that could cause actual results to differ materially from such forward-looking information include, but are not limited to, changes in the state of equity and debt markets, fluctuations in commodity prices, delays in obtaining required regulatory or governmental approvals, and includes those risks set out in the Company’s management’s discussion and analysis as filed under the Company’s profile at www.sedar.com. Forward-looking information in this news release is based on the opinions and assumptions of management considered reasonable as of the date hereof, including that all necessary governmental and regulatory approvals will be received as and when expected. Although the Company believes that the assumptions and factors used in preparing the forward- looking information in this news release are reasonable, undue reliance should not be placed on such information. The Company disclaims any intention or obligation to update or revise any forward-looking information, other than as required by applicable securities laws.
Neither the CSE nor its Regulation Services Provider (as that term is defined in the policies of the CSE) accepts responsibility for the adequacy or accuracy of this release.
Photos accompanying this announcement are available at:
https://www.globenewswire.com/NewsRoom/AttachmentNg/bf1f0a70-0387-40d2-89ed-8f96ddfc2d38
https://www.globenewswire.com/NewsRoom/AttachmentNg/ad4a800c-c8f4-49fd-a98b-071feff92a7b
https://www.globenewswire.com/NewsRoom/AttachmentNg/66131489-55d1-4fd7-a709-61d9e87d8a6e
